Hdtdr plot – Fluke Networks CertiFiber Pro Users Manual User Manual
Page 158
Versiv Cabling Certification Product Family
Technical Reference Handbook
136
GPU115.EPS
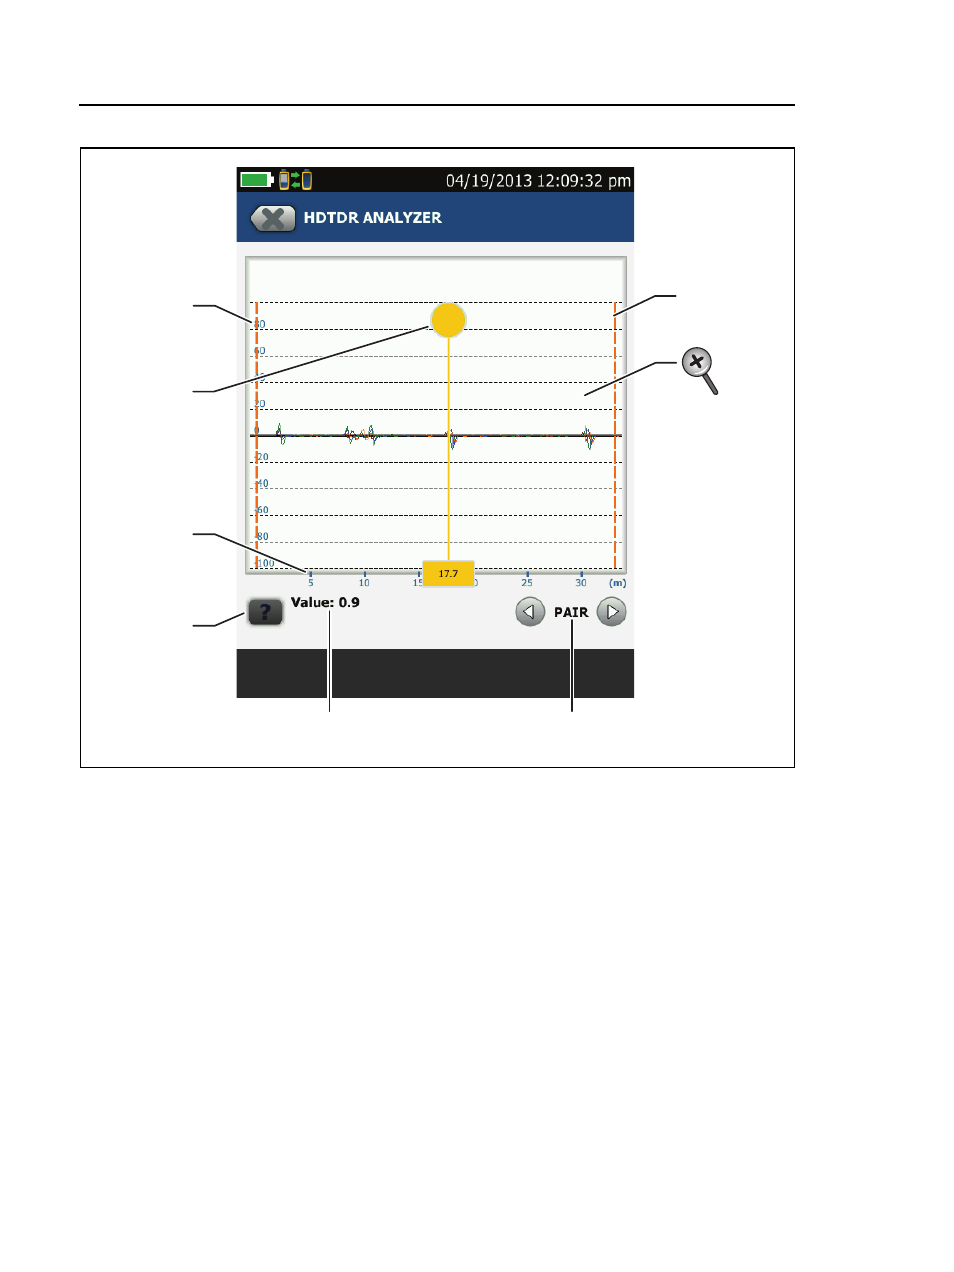
Figure 65. HDTDR Plot
The vertical scale shows the percentage of the signal reflected
back to the main tester. The amplitudes of signals on the plot
show how much the impedance of the cabling changes.
The measurement cursor. The box at the bottom of the cursor
shows the distance from the start of the cabling to the cursor.
To measure distance, tap the yellow circle so that MARK shows,
drag the cursor to the start of the measurement, tap MARK,
then drag the cursor to the end of the measurement. See “How
to Use the Measurement Cursor on the HDTDR and HDTDX
Plot” on page 143.
The horizontal scale shows the distance along the cabling.
B
D
A
E
G
F
C