How the 3 db rule shows on plots – Fluke Networks CertiFiber Pro Users Manual User Manual
Page 139
Chapter 3: How to Certify Twisted Pair Cabling
About dB Rules
117
GPU58.EPS
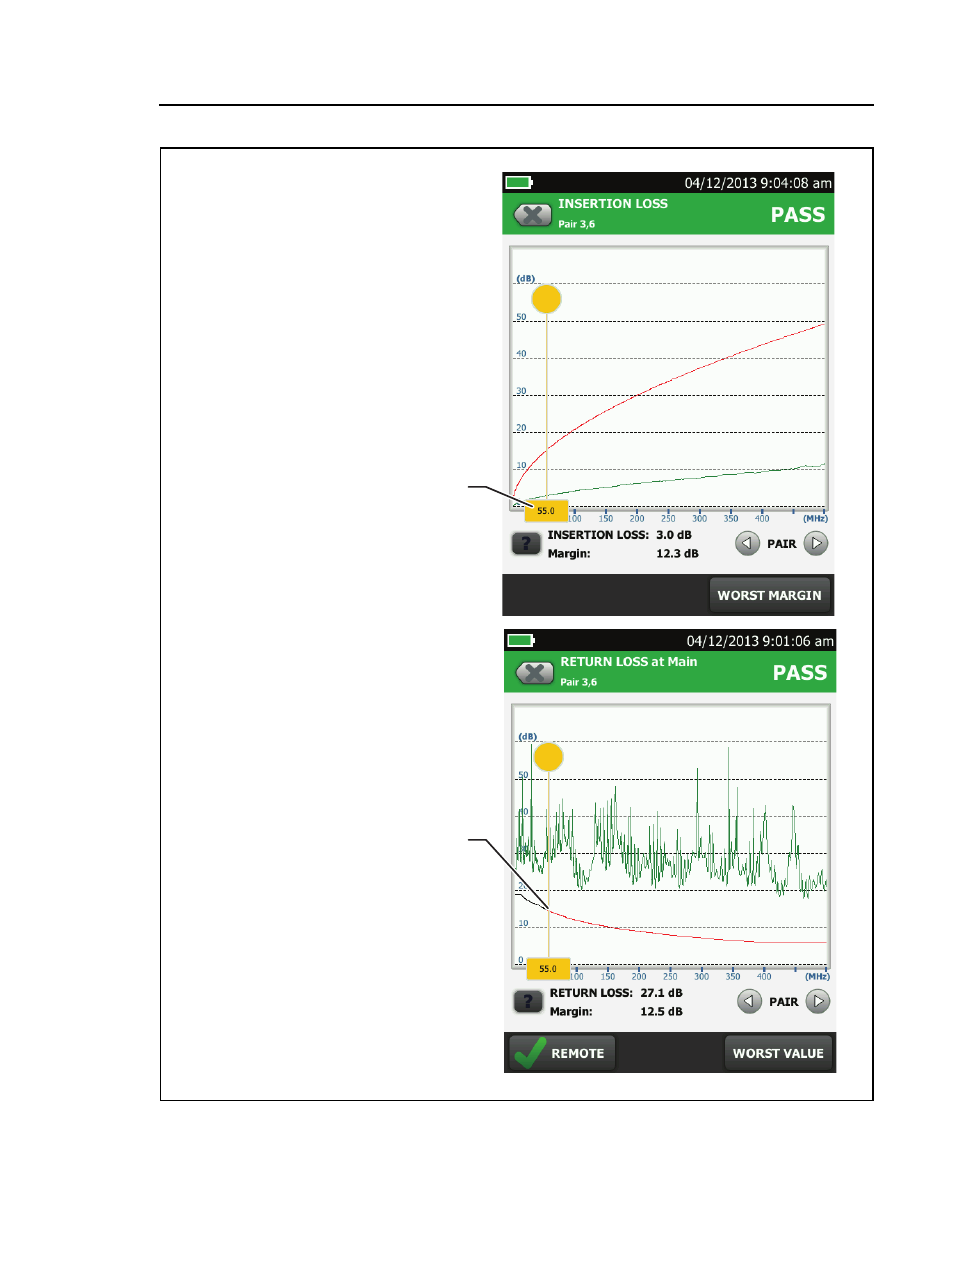
Figure 60. How the 3 dB Rule Shows on Plots
Below this frequency,
insertion loss is less
than 3.0 dB.
Below this frequency, the
limit line for return loss is
black because RL is not
evaluated against the limit.
When the plot shows all
pairs, the limit line is red
where any pair was
evaluated.