Acr-n plot – Fluke Networks CertiFiber Pro Users Manual User Manual
Page 125
Chapter 3: How to Certify Twisted Pair Cabling
Twisted Pair Autotest Results
103
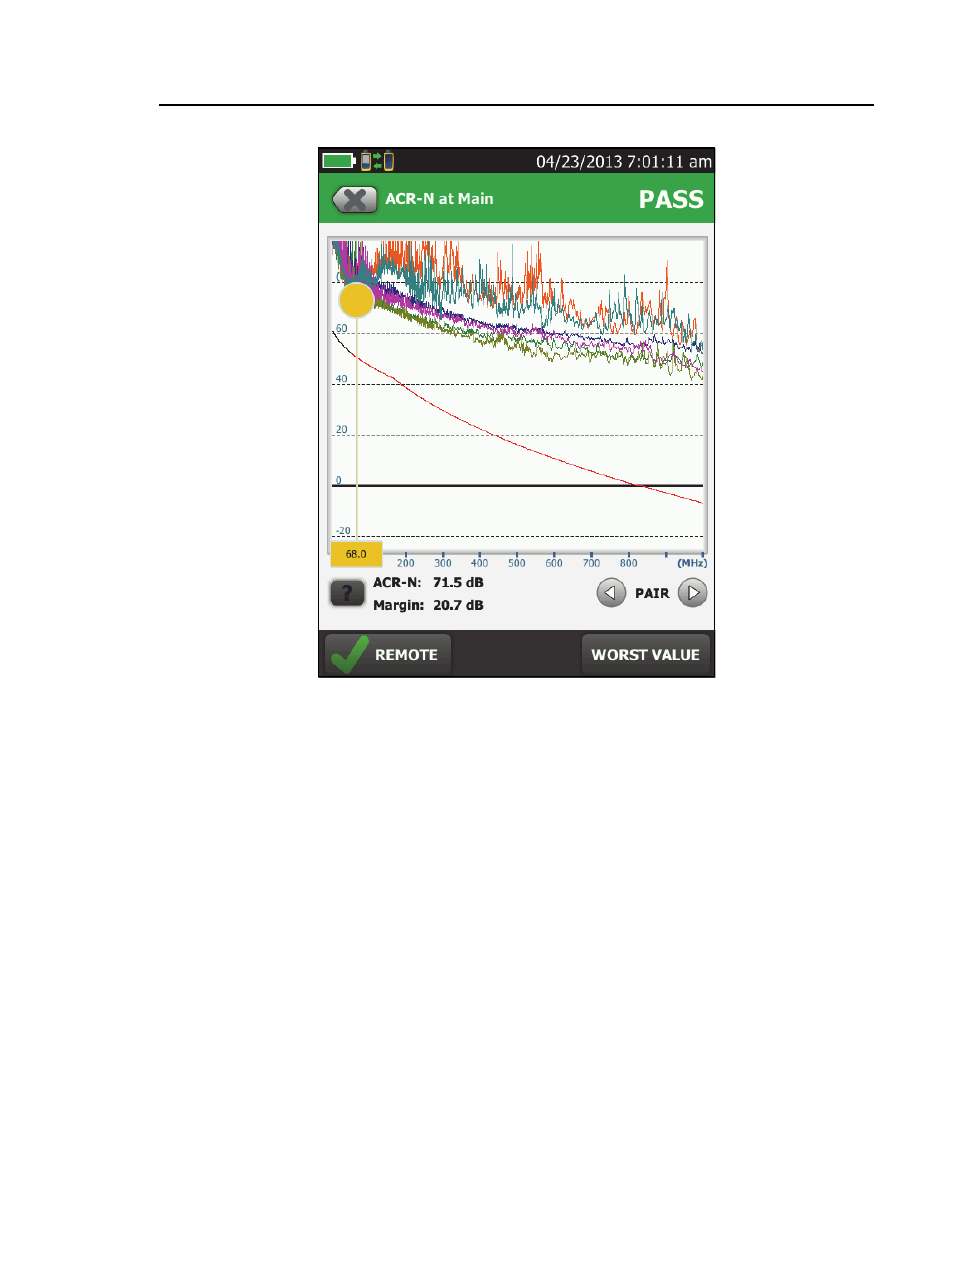
GPU73.PNG
Figure 49. ACR-N Plot
PS ACR-N (Power Sum Attenuation to
Crosstalk Ratio, Near End)
PS ACR-N values show how the amplitude of signals received from
a far-end transmitter compares to the combined amplitudes of
crosstalk produced by near-end transmissions on the other wire
pairs. PS ACR-N is the difference (in dB) between PS NEXT and
attenuation (insertion loss). The tester uses the PS NEXT and
attenuation results to calculate PS ACR-N values. Higher PS ACR-N
values mean received signals are much larger than the crosstalk
from all the other wire pairs. Higher PS ACR-N values correspond
to better cabling performance.
PS ACR-N is the difference (in dB) between each wire pair’s
attenuation (insertion loss) and the combined crosstalk received