Ps acr-n plot – Fluke Networks CertiFiber Pro Users Manual User Manual
Page 126
Versiv Cabling Certification Product Family
Technical Reference Handbook
104
from the other pairs. The tester uses the PS NEXT and attenuation
values to calculate PS ACR-N values.
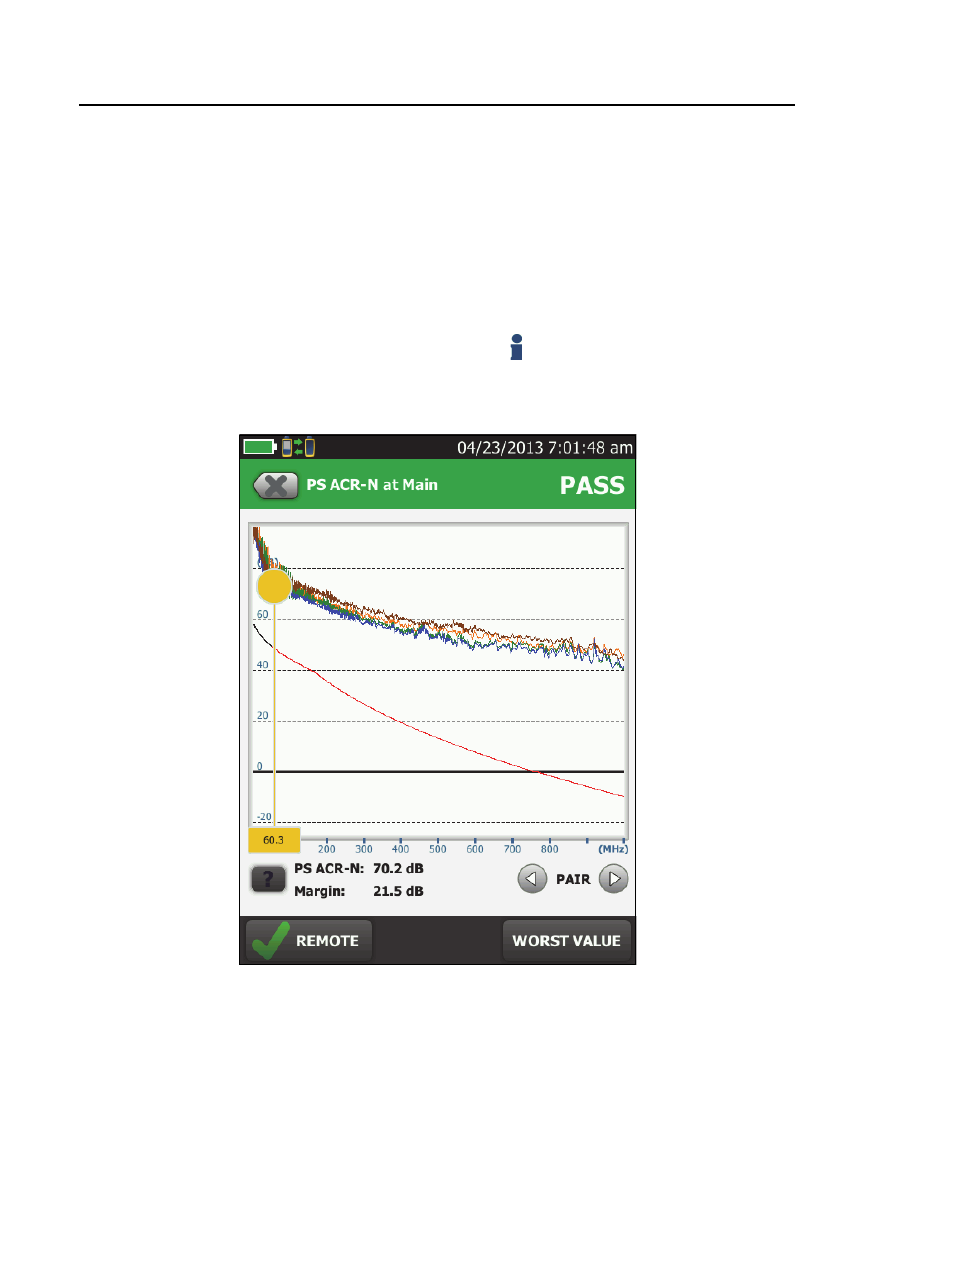
PS ACR-N results are typically a few dB lower (worse) than worst-
case ACR-N results. Figure 50 shows the PS ACR-N plot. The tester
puts the cursor at the worst margin.
Note
If the PS ACR-N result is an an , the 4 dB rule
applies. See “About dB Rules” on page 116.
GPU106.PNG
Figure 50. PS ACR-N Plot