Eventmap example 1 – Fluke Networks CertiFiber Pro Users Manual User Manual
Page 265
Chapter 9: How to Use the OptiFiber Pro OTDR Module
OTDR Results
243
GPU11EPS
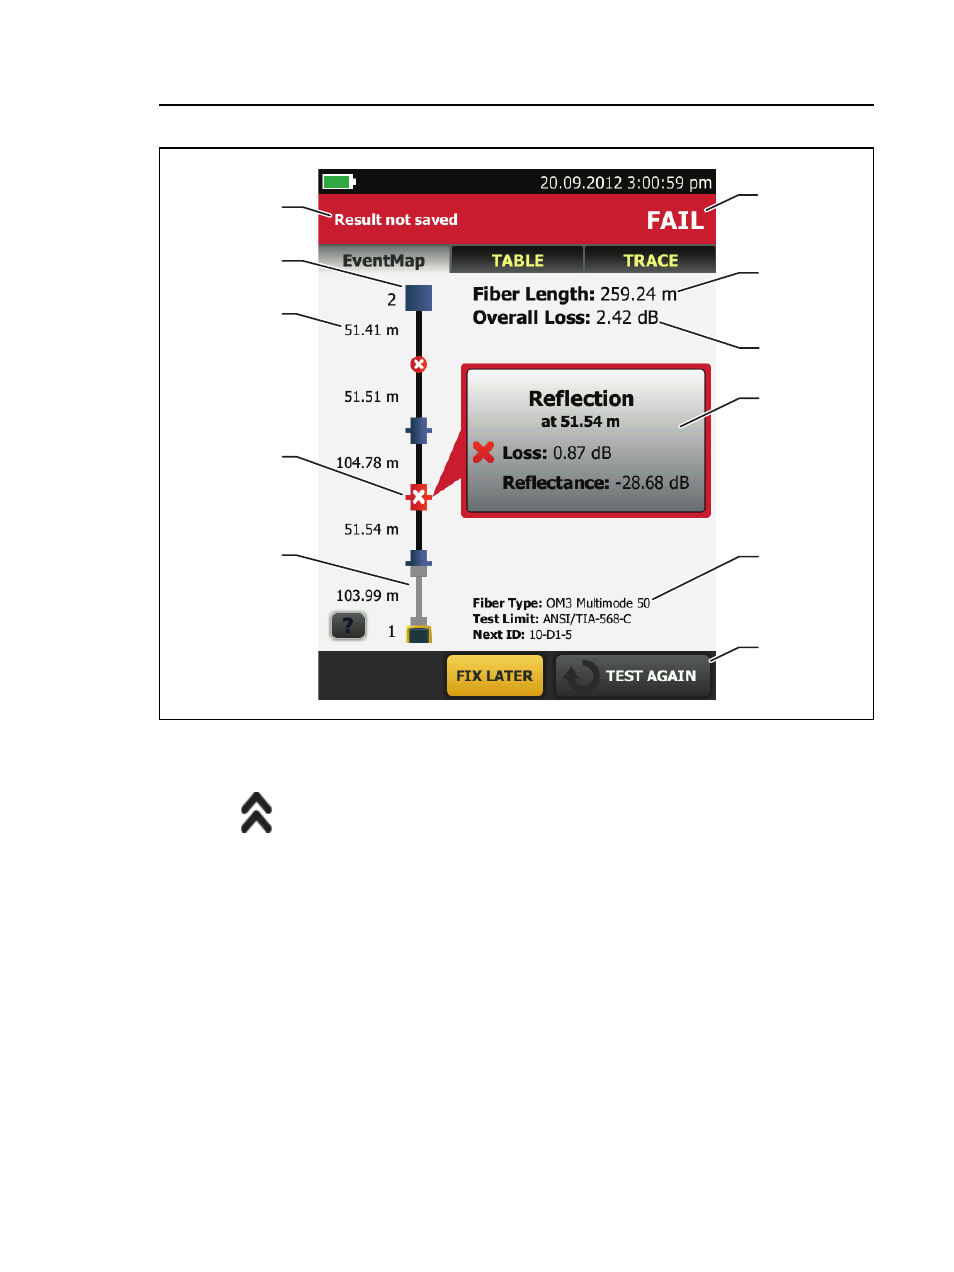
Figure 107. EventMap Example 1
: The arrow icon shows when there are more events that do
not show on the screen. To see the events, tap the icon or scroll
the map.
When more than one button shows at the bottom of the screen,
the tester highlights one in yellow to recommend which one to
tap. See “Buttons to Do Tests and Save Results” on page 53.
The fiber type and test limit the tester used for the test, and the
ID the tester will use for the next results that you save.
When a test is completed, the window shows information for the
event that has the worst measurement. The information
windows show the worst results of the wavelengths used for the
test.
A
B
D
C
K
H
J
G
F
E
I