San main toolbar – Brocade Network Advisor SAN User Manual v12.3.0 User Manual
Page 405
Brocade Network Advisor SAN User Manual
353
53-1003154-01
SAN tab overview
8
6. Port Display buttons — Provides buttons that enable quick access to configuring how ports
display. Not enabled until you discover a fabric or host. For more information, refer to
7. Connectivity Map toolbar — Provides tools for viewing the Connectivity Map as well as exporting
the Connectivity Map as an image. Does not display until you discover a fabric. For more
information, refer to
8. Product List — Lists the devices discovered in the Management application. For more detailed
information, refer to
9. Connectivity Map — Displays the topology, including discovered and monitored devices and
connections. For more information, refer to
10. Master Log — Displays all events that have occurred on the Management application. For more
information, refer to
11. Utilization Legend — (Trial and Licensed version only) Indicates the percentage ranges
represented by the colored, dashed lines on the Connectivity Map. Only displays when you
select Monitor > Performance > View Utilization or click the Utilization icon on the toolbar. For
more information, refer to
12. Minimap — Displays a “bird’s-eye” view of the entire topology. Does not display until you
discover a fabric. For more information, refer to
13. Status bar — Displays the connection, port, product, fabric, special event, call home, and
backup status, as well as Server and User data. For more information, refer to
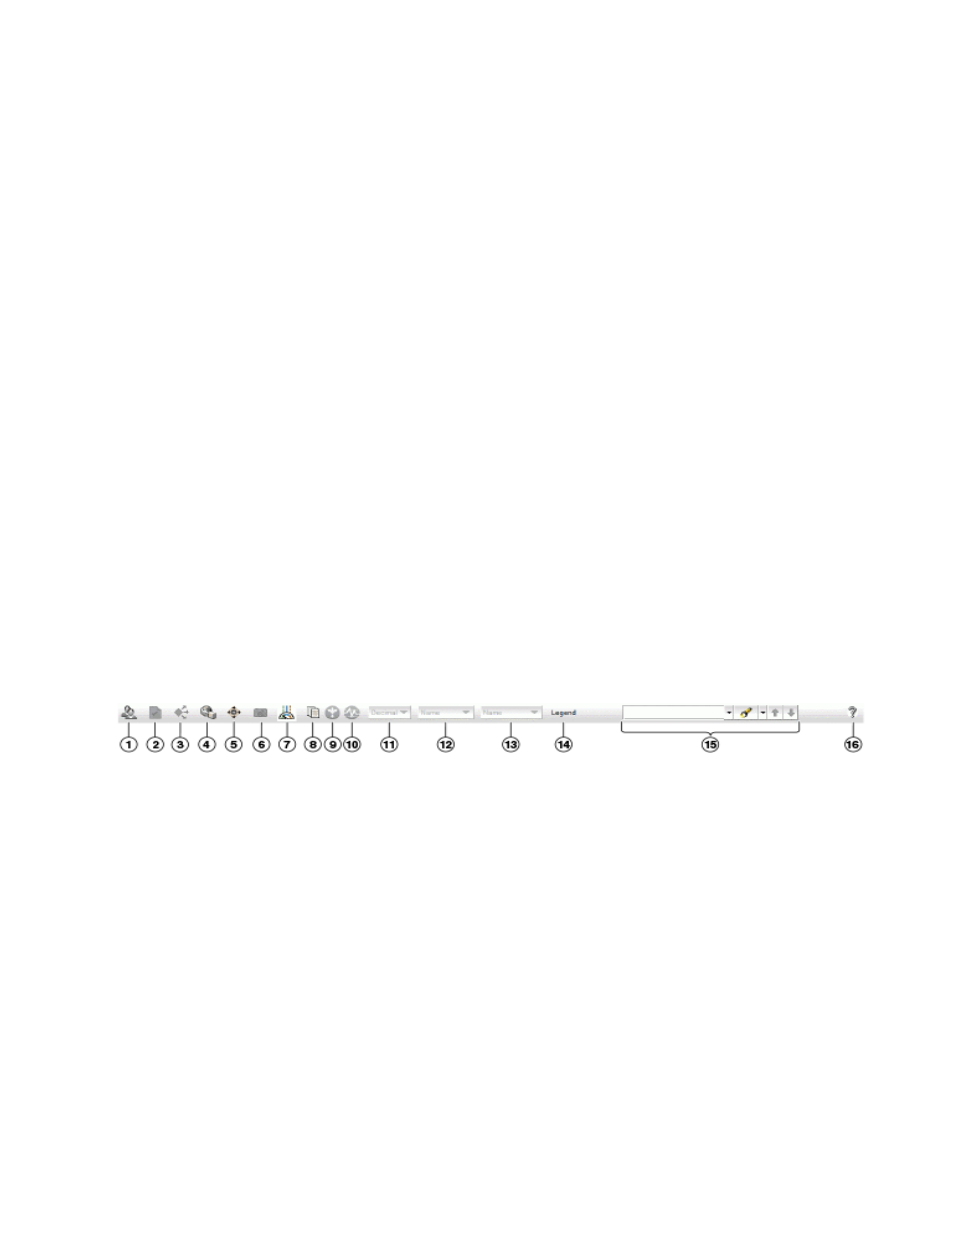
SAN main toolbar
The toolbar is located beneath the Menu bar and provides icons to perform various functions.
FIGURE 151
SAN main toolbar
The icons on your toolbar vary based on the licensed features on your system.
1. Users — Displays the Users dialog box. Use to configure users, user groups, and permissions.
2. Properties — Displays the Properties dialog box of the selected device or fabric. Use to view or
edit device or fabric properties.
3. Launch Element Manager — Launches the Element Manager of the selected device. Use to
configure a device through its Element Manager.
4. Fabric discovery — Displays the Discover Fabrics dialog box. Use to configure discovery.
5. Zoning — Displays the Zoning dialog box. Use to configure zoning.
6. Track Fabric Changes — Select to turn track fabric changes on or off for the selected device or
group.
7. View Utilization — Displays or hides the utilization legend.
8. View Report — Displays the View Reports dialog box. Use to view available reports.