San inventory widget – Brocade Network Advisor SAN User Manual v12.3.0 User Manual
Page 339
Brocade Network Advisor SAN User Manual
287
53-1003154-01
Status widgets
7
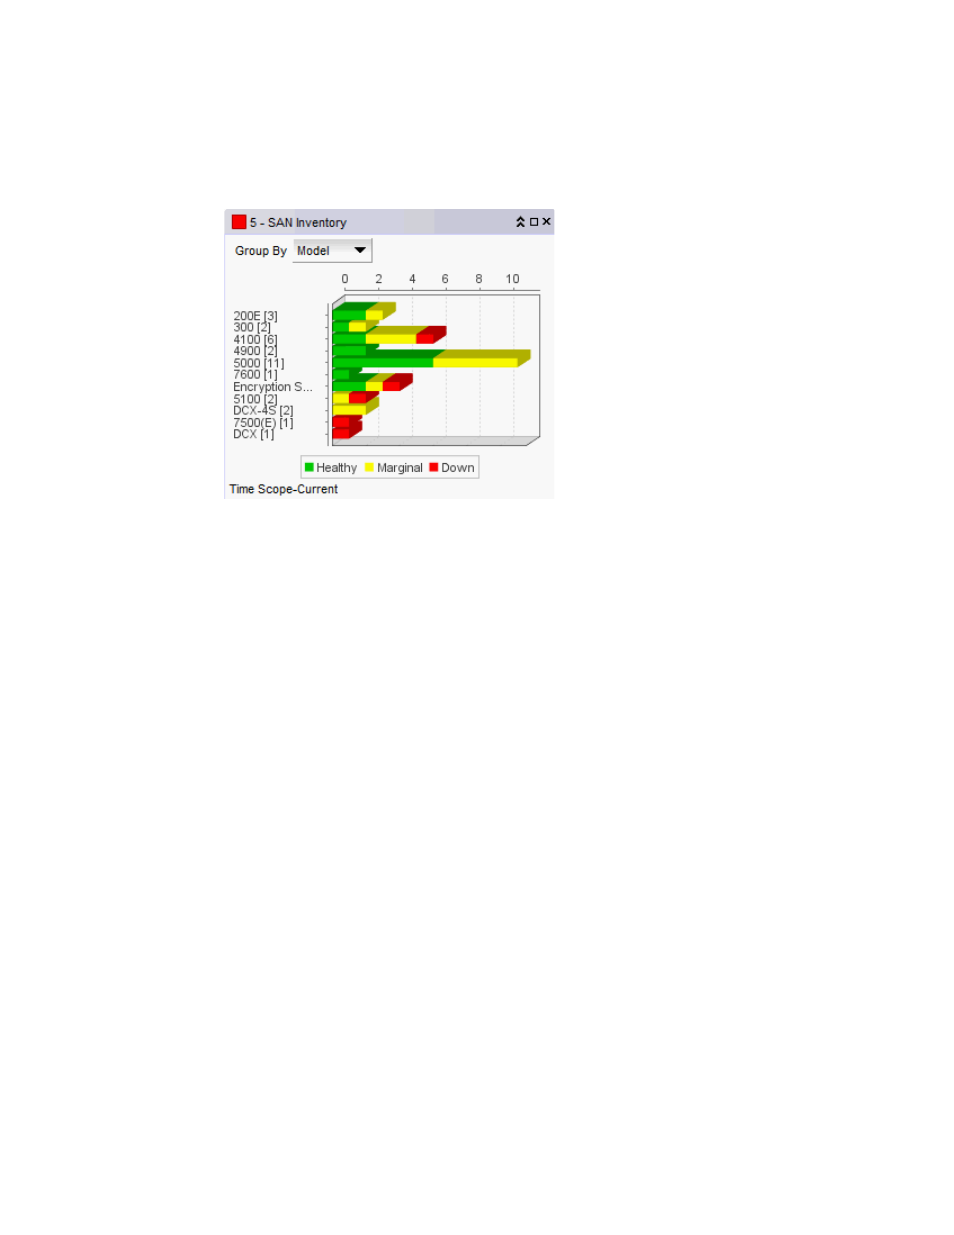
SAN Inventory widget
The SAN Inventory widget (
) displays the SAN products inventory as stacked bar graphs.
FIGURE 122
SAN Inventory widget
The SAN Inventory widget includes the following data:
•
Severity icon/product count/widget title — The color of the worst severity followed by the
number of products with that severity displays before the widget title.
•
Group By list — Use to customize this widget to display a specific group of products. Options
include: Firmware, Model, Location, and Contact.
•
Bar chart — The product status as a percentage of the total number of products.
The bar chart displays each group as a separate bar on the graph. Displays the current state of
all products discovered for a group in various colors on each bar. Tooltips showing the number
of devices in that state are shown when you pause on the bar.
•
Color legend — Displays the color legend below the bar chart using the following color codes:
-
Green — Healthy: Status obtained from the SAN switch based on Fabric Watch or
Monitoring and Alerting Policy Suite (MAPS) thresholds configured on the switch.
-
Yellow — Marginal: Status obtained from the SAN switch based on Fabric Watch or MAPS
thresholds configured on the switch.
-
Red — Down: Status obtained from the SAN switch based on Fabric Watch or MAPS
thresholds configured on the switch.
-
Blue — Not Reachable: SAN switch is not reachable by HTTP.
-
Gray — Unknown: Temporary status that displays when switch asset collection is in
progress. Once switch asset collection is complete, the current status is obtained from the
switch.
•
Time Scope — The time scope.