San status widget – Brocade Network Advisor SAN User Manual v12.3.0 User Manual
Page 341
Brocade Network Advisor SAN User Manual
289
53-1003154-01
Status widgets
7
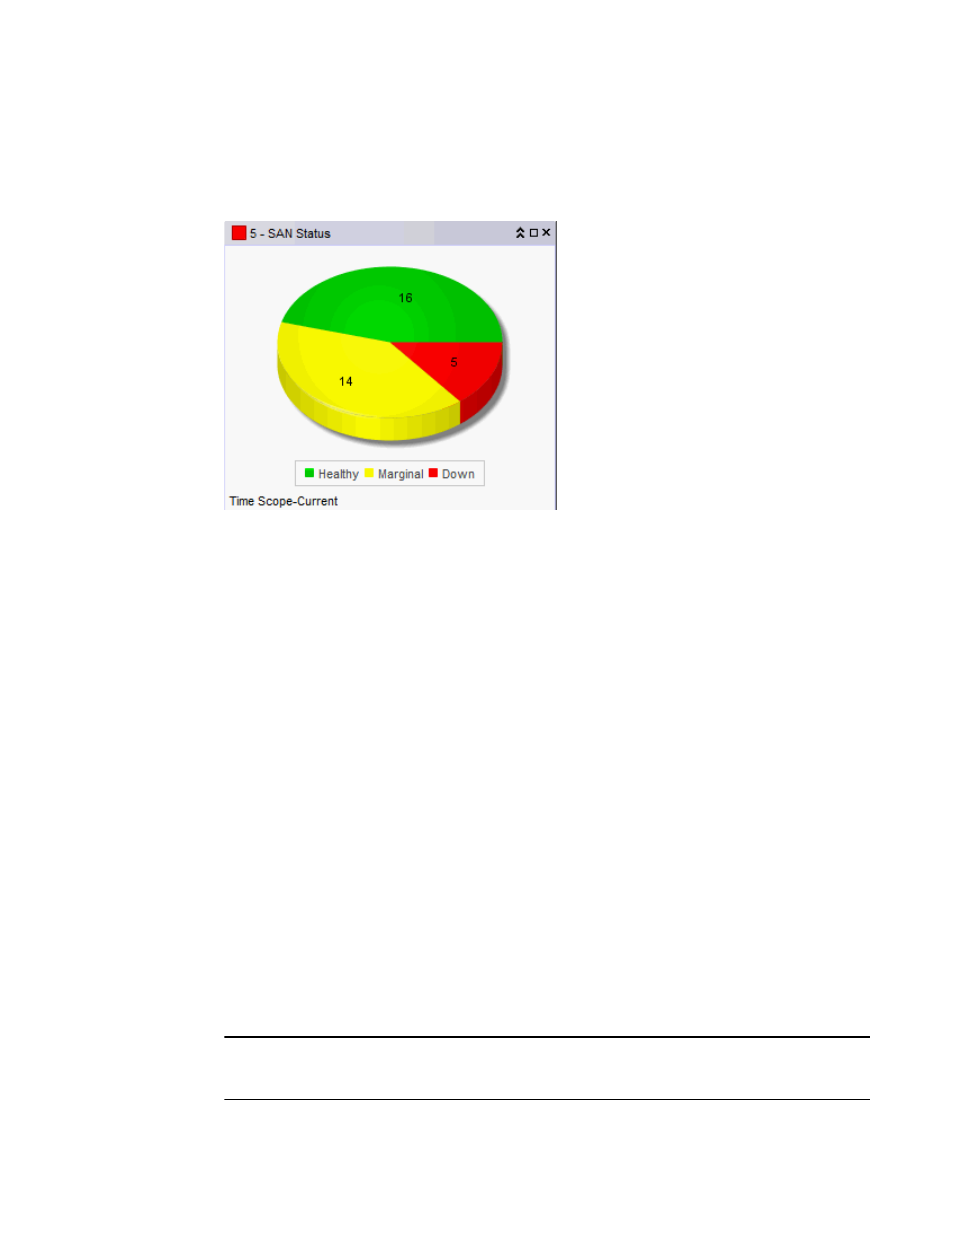
SAN Status widget
The SAN Status widget (
) displays the device status as a pie chart.
FIGURE 123
SAN Status widget
The SAN Status widget includes the following data:
•
Severity icon/product count/widget title — The color of the worst status followed by the number
of products with that status displays before the widget title.
•
Pie chart — The device status as a percentage of the total number of devices.
The pie chart displays the percentage in various colors on each slice. Tooltips showing the
number of devices in that state are shown when you pause on the slice. When there is one
status category with less than one percent of the total number of devices, the status widget
displays the number of devices in each category on each slice.
•
Color legend — Displays the color legend below the bar chart using the following color codes:
-
Green — Healthy
-
Yellow — Marginal
-
Red — Down
-
Blue — Not Reachable
-
Gray — Unknown
•
Time Scope — The time scope.
Accessing additional data from the SAN Status widget
Double-click a section in the SAN Status widget to navigate to the SAN Products - Status dialog box
(where Status is the section of the widget you selected). For more information, refer to
NOTE
It takes a few moments to populate newly discovered products in the SAN Products - Status dialog
box (where Status is the section of the widget you selected).