Top port overflow errors monitor – Brocade Network Advisor SAN User Manual v12.3.0 User Manual
Page 360
308
Brocade Network Advisor SAN User Manual
53-1003154-01
Performance monitors
7
•
TX Link Resets/sec — The number (error rate) of transmit link reset errors for the duration
specified in the monitor.
•
TX Link Resets — The number (error count) of transmit link reset errors.
•
Product — The product affected by this monitor.
•
Type — The type of port (for example, U-Port).
•
Identifier — The port identifier.
•
Port Number — The port number.
•
State — The port state (for example, Enabled).
•
Status — The port status (for example, Up).
•
Refreshed — The time of the last update for the monitor.
To customize the monitor to display data by a selected time frame as well as customize the display
options, refer to
“Editing a preconfigured performance monitor”
Accessing additional data from the Top Port Link Resets monitor
•
Right-click a row in the monitor to access the shortcut menu available for the associated
device. For more information about shortcut menus, refer to
•
Double-click a row to navigate to the SAN Historical Graphs/Tables dialog box. For more
information, refer to
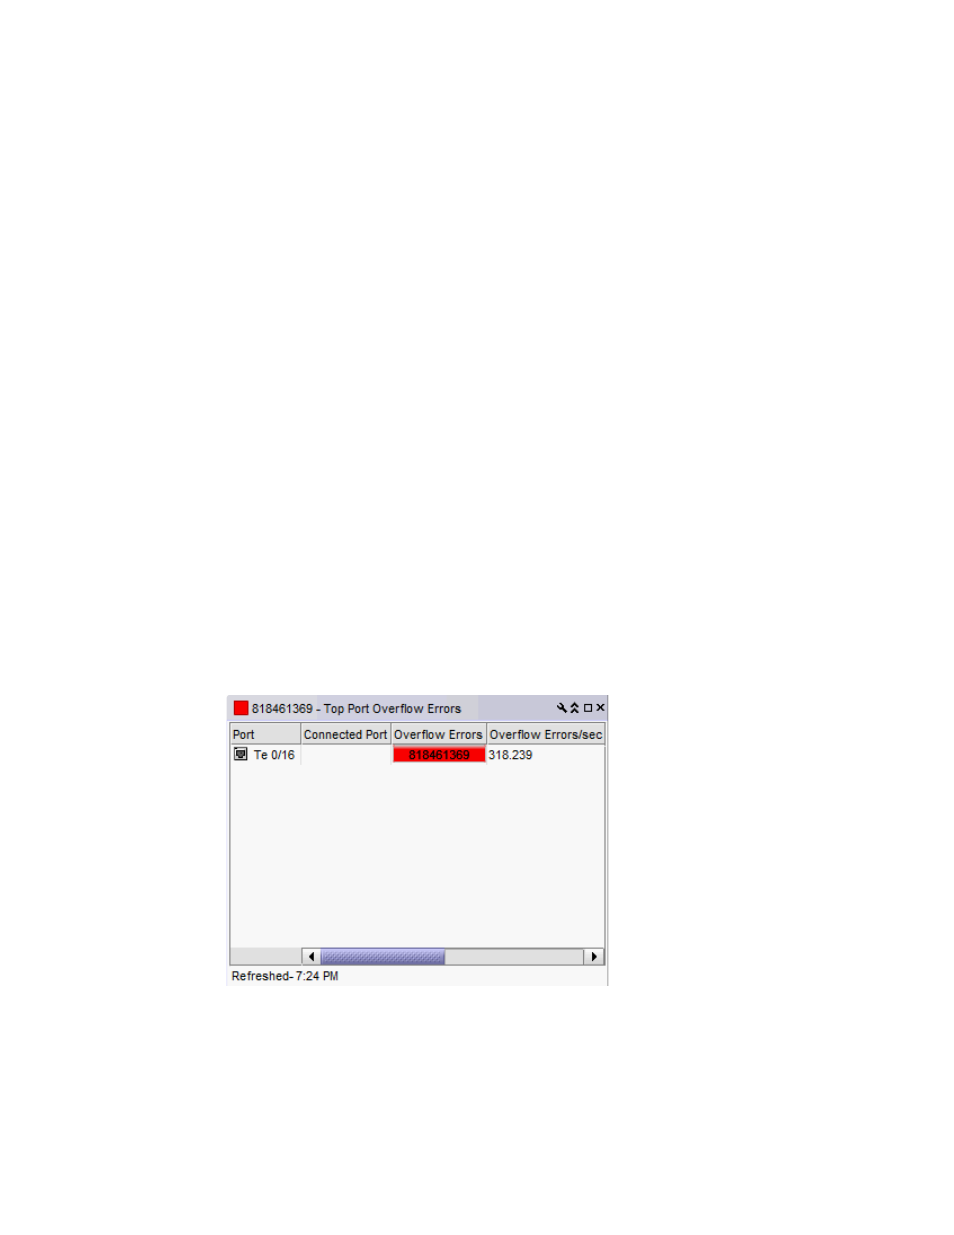
Top Port Overflow Errors monitor
The Top Port Overflow Errors performance monitor (
) displays the top ports with overflow
errors in a table.
FIGURE 133
Top Port Overflow Errors performance monitor
The Top Port Overflow Errors performance monitor includes the following data:
•
Threshold icon/object count/monitor title — The color associated with the threshold and
number of objects within that threshold displays next to the monitor title.
•
Port — The port affected by this monitor.