Brocade Network Advisor SAN User Manual v12.3.0 User Manual
Page 1127
Brocade Network Advisor SAN User Manual
1075
53-1003154-01
SAN real-time performance data
28
1. Select the fabric, device, or port for which you want to generate a performance graph.
Right-click and select Performance > Real-Time Graph/Table or select Monitor > Performance
> Real-Time Graph. The Real Time Graphs/Tables dialog box displays.
If you selected a port, the Real Time Performance Graphs dialog box for the selected port
displays. To filter real-time performance data from the Real Time Performance Graphs dialog
box, refer to
“Filtering real-time performance data”
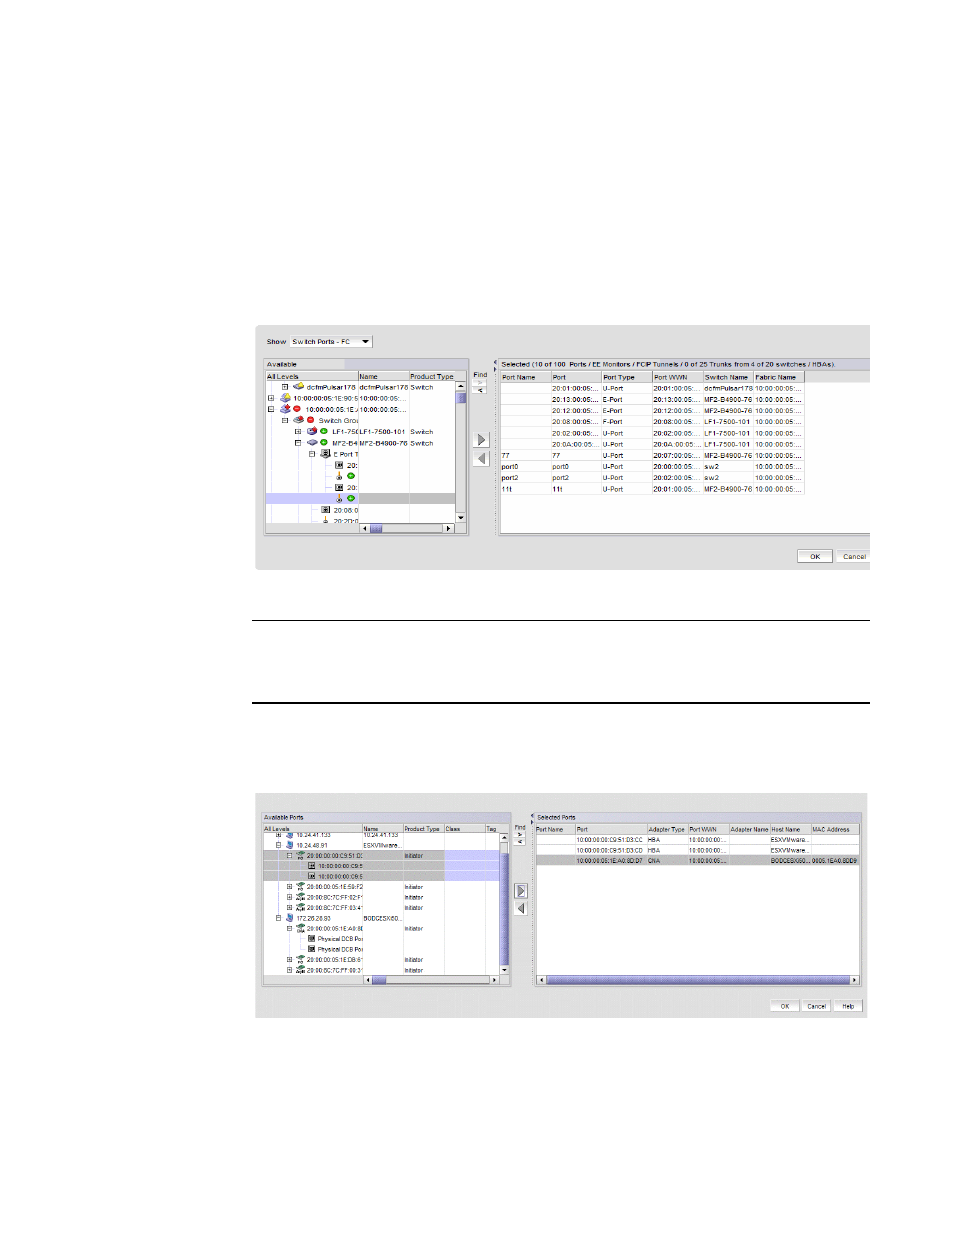
If you selected a fabric or a device, the Realtime Port Selector dialog box displays, as shown in
. Continue with
FIGURE 474
Realtime Port Selector dialog box
NOTE
You can set columns in the right side of the dialog box for FICON display using Server > Options
> SAN Display. The first eight columns will display FC Address, Serial #, Tag, Product Type,
Model, Vendor, Port Name, Port Type, and Port WWN.
If you selected a host adapter, the Realtime Port Selector - Hosts dialog box displays with all
the managed HBA and CNA ports of the discovered hosts, as shown in
. Continue
with
FIGURE 475
Realtime Port Selector - Hosts dialog box
2. From the Show list, select the object type for which you want to performance graph.