Top product cpu utilization monitor – Brocade Network Advisor SAN User Manual v12.3.0 User Manual
Page 369
Brocade Network Advisor SAN User Manual
317
53-1003154-01
Performance monitors
7
•
State — The port state (for example, Enabled).
•
Status — The port status (for example, Up).
•
Refreshed — The time of the last update for the monitor.
To customize the monitor to display data by a selected time frame as well as customize the display
options, refer to
“Editing a preconfigured performance monitor”
Accessing additional data from the Top Port Utilization monitor
•
Right-click a row in the monitor to access the shortcut menu available for the associated
device. For more information about shortcut menus, refer to
•
Double-click a row to navigate to the Historical Graphs/Tables dialog box. For more
information, refer to
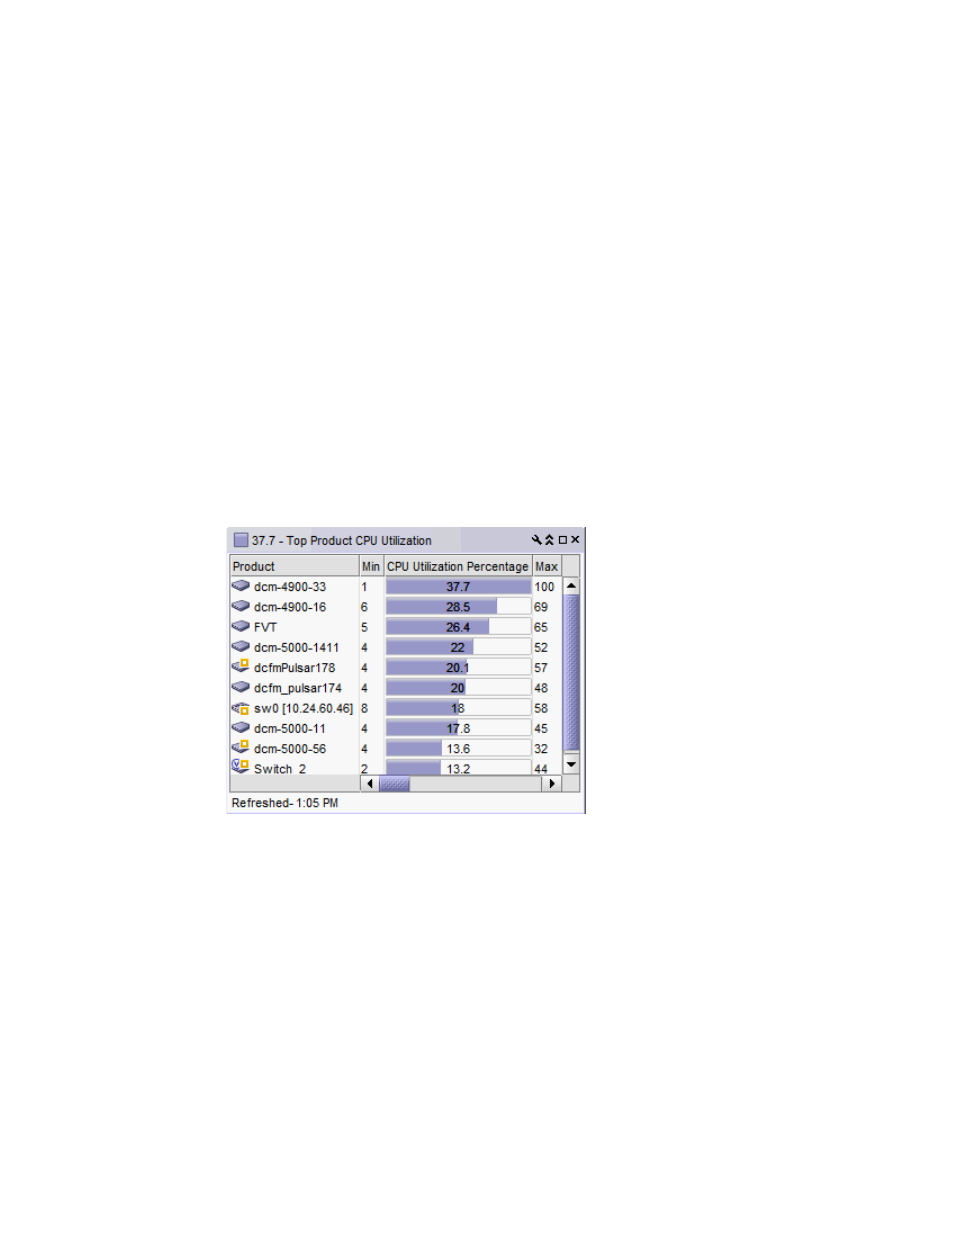
Top Product CPU Utilization monitor
The Top Product CPU Utilization monitor (
) displays the top product CPU utilization
percentages in a table.
FIGURE 138
Top Product CPU Utilization monitor
The Top Product CPU Utilization monitor includes the following data:
•
Severity icon/monitor title — The worst severity of the data shown next to the monitor title.
•
Product — The product affected by this monitor.
•
Min — The minimum value of the measure in the specified time range.
•
CPU Utilization Percentage — The CPU utilization percentages.
•
Max — The maximum value of the measure in the specified time range.
•
Fabric — The fabric to which the device belongs.
•
Product Type — The type of product (for example, switch).
•
State — The product state (for example, Offline).
•
Status — The product status (for example, Reachable).