Events widget – Brocade Network Advisor SAN User Manual v12.3.0 User Manual
Page 226
174
Brocade Network Advisor SAN User Manual
53-1003154-01
Dashboard customization
6
•
Type — The port type.
•
Identifier — The port identifier, such as port name, number, address, WWN, user port number,
or zone alias.
•
Port Number — The port number.
•
State — Whether the port is online or offline.
•
Status — Whether the port is online or offline.
Customizing the Bottlenecked Ports widget
You can customize the widget to display data for a specific fabric and duration.
•
To display data for a specific fabric or group, refer to
•
To display data for a specific duration, refer to
“Configuring the dashboard display”
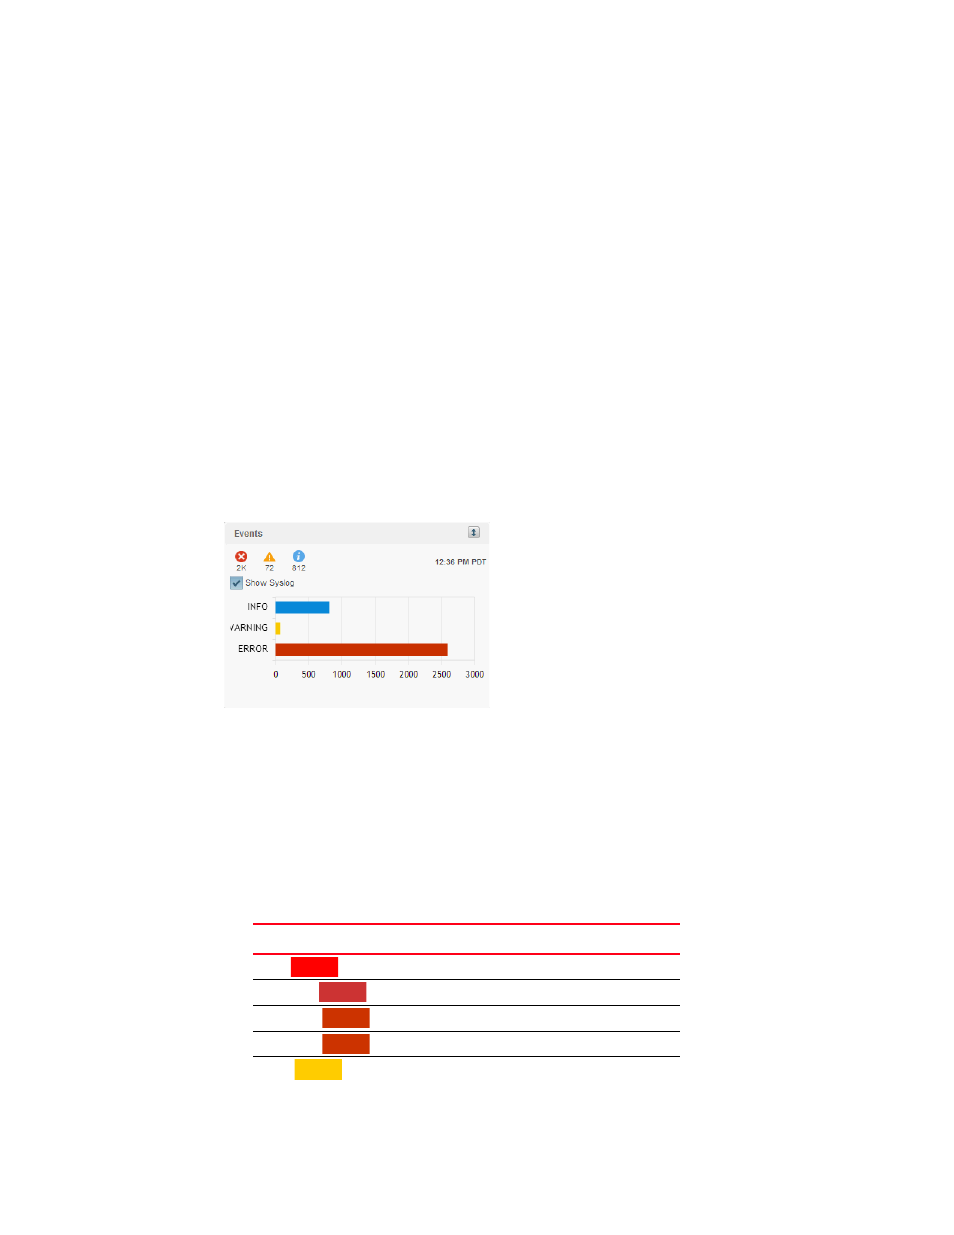
Events widget
The Events widget (
) displays the number of events by severity level for a specified time
range as a stacked bar graph.
FIGURE 58
Events widget
The Events widget includes the following data:
•
Widget title — The name of the widget.
•
Widget summary — The product count for each status (worst to best order) with the associated
icon displays underneath the widget title.
•
Show Syslog check box — Select to include Syslog information (default) on the Event Summary.
•
Bar chart — The event severity using the color-codes in
.
TABLE 18
Event severity color codes
Color
Severity
Red
(
)
Emergency
Brick Red
(
)
Alert
Brick Red
(
)
Critical
Brick Red
(
)
Error
Gold
(
)
Warning