Status widgets, Bottlenecked ports widget, Status – Brocade Network Advisor SAN User Manual v12.3.0 User Manual
Page 333: Widgets
Brocade Network Advisor SAN User Manual
281
53-1003154-01
Status widgets
7
Status widgets
The Management application provides the following preconfigured status widgets:
•
— Table view of bottlenecked ports and number of violations for
each bottlenecked port in the SAN. There are four versions of this monitor based on the type of
port: All ports, initiator ports, ISL ports, and Target ports.
•
— Bar chart view of events grouped by severity and
range
•
— Stacked bar chart view of Host Adapters grouped by selected
category
•
Out of Range Violations widget
— Table view of all out of range threshold violations reported by
your SAN devices
— Table view of out of range port health
violations. There are four versions of this monitor based on the type of port: All ports, initiator
ports, ISL ports, and Target ports.
•
— Stacked bar chart view of FC devices grouped by operational status
and selected category
•
— Pie chart view of FC devices categorized by operational status
•
— List view of various status attributes
•
— Table view of alarms received from vCenter products
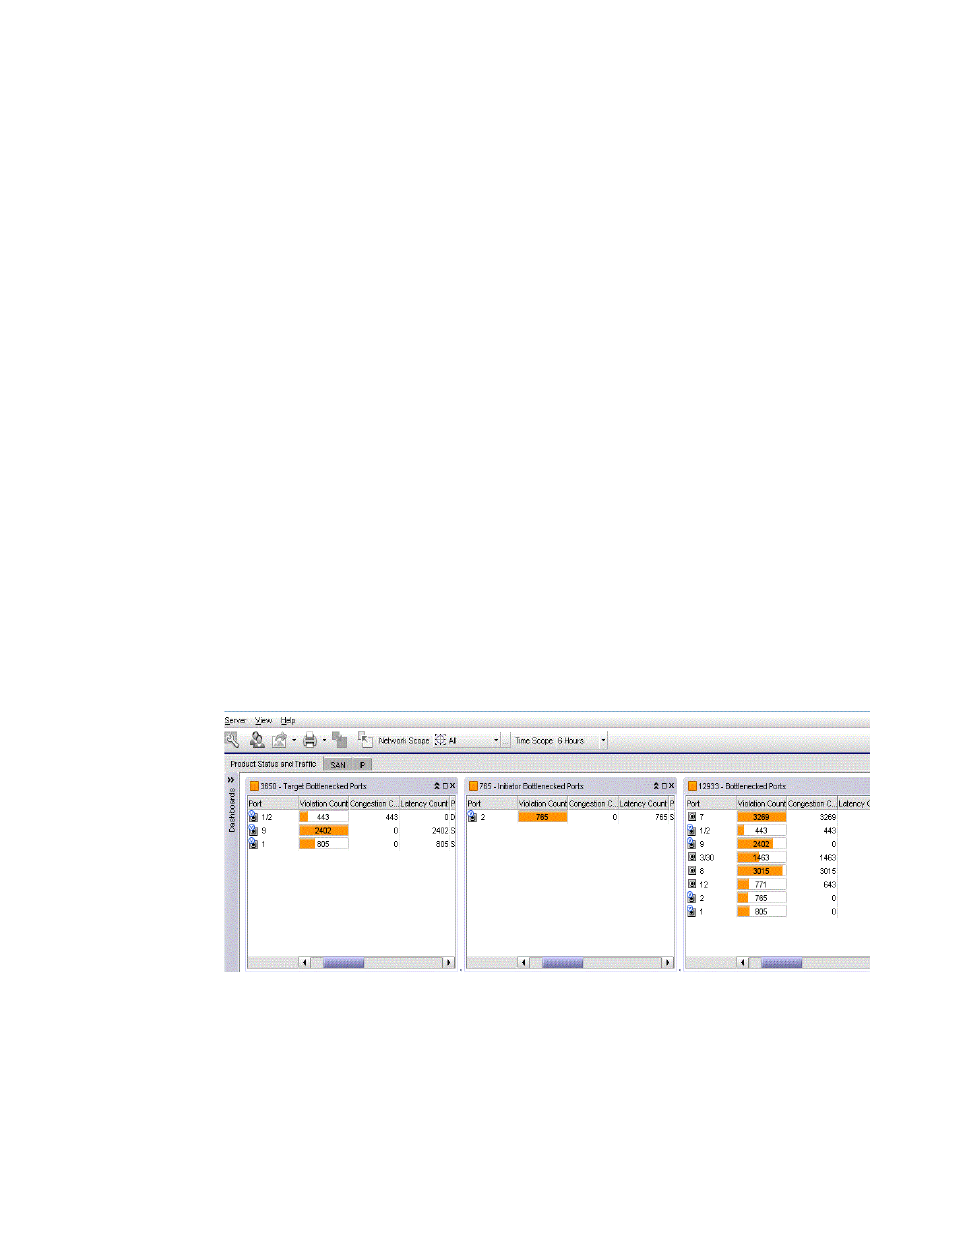
Bottlenecked Ports widget
The Bottlenecked Ports widget (
) displays the bottlenecked port violations for the
specified fabric and time range in a table. There are four bottlenecked port widgets: All, ISL,
Initiator, and Target.
FIGURE 118
Bottlenecked Ports widget
The Bottlenecked Ports widget includes the following data:
•
Severity icon/violation count/widget title — The color of the worst severity and the total number
of ports with congestion and latency violations are displayed before the widget title.