Brocade Network Advisor SAN User Manual v12.3.0 User Manual
Page 272
220
Brocade Network Advisor SAN User Manual
53-1003154-01
Inventory
6
•
Time — Displays the time on the server when the violation was reported.
•
Rule Condition — Displays the conditions defined in the MAPS policy that was triggered.
•
Product — Displays the name of the product.
•
Object Name — Displays the object (such as switch name, port name, FRU name, and so
on) on which the violation occurred.
•
Fabric Name — Displays the Fabric name to which the object belongs.
•
Category — Displays the MAPS category (such as Port, Switch Status, Fabric, FRU, Security,
Resource, FCIP, and Traffic/Flows).
•
Rule Name — Displays the name of the rule. A rule associates a condition with actions that
need to be triggered when the specified condition is evaluated to be true.
•
Table functions — For a description of how to use the Violations table functionality, refer to
FIGURE 91
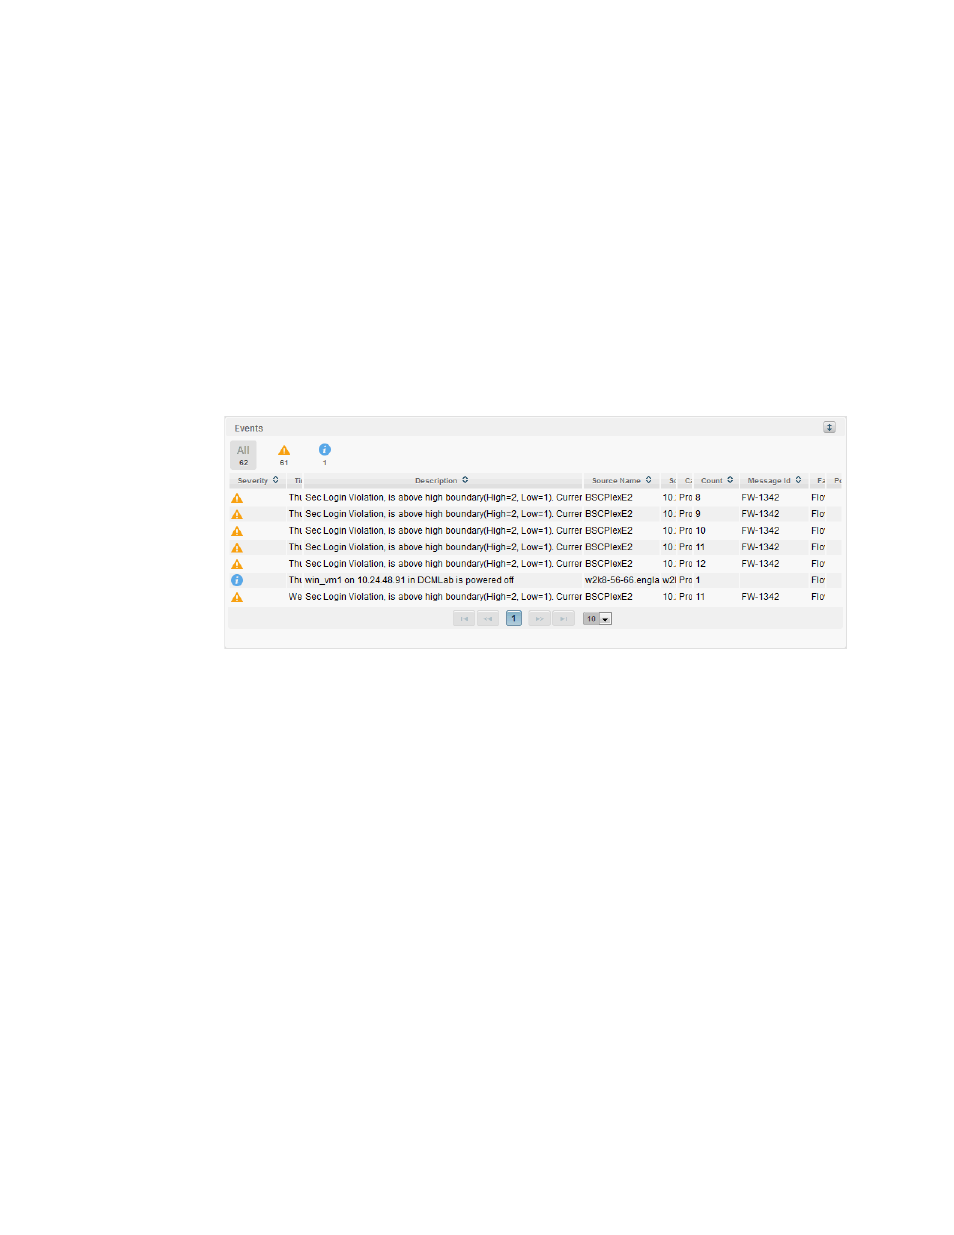
Events table
The Events table displays the following details for events triggered in the fabric:
•
Collapse/Expand button — Click to collapse or expand the view.
•
All — Displays the total number of events triggered.
•
Emergency icon — Displays the total number of Emergency events triggered. Click to only
display Emergency events in the table.
•
Alert icon — Displays the total number of Alert events triggered. Click to only display Alert
events in the table.
•
Critical icon — Displays the total number of Critical events triggered. Click to only display
Critical events in the table.
•
Error icon — Displays the total number of Error events triggered. Click to only display Error
events in the table.
•
Warning icon — Displays the total number of Warning events triggered. Click to only display
Warning events in the table.
•
Notice icon — Displays the total number of Notice events triggered. Click to only display
Notice events in the table.
•
Info icon — Displays the total number of Information events triggered. Click to only display
Information events in the table.
•
Debug icon — Displays the total number of Debug events triggered. Click to only display
Debug events in the table.