Top port link resets monitor – Brocade Network Advisor SAN User Manual v12.3.0 User Manual
Page 359
Brocade Network Advisor SAN User Manual
307
53-1003154-01
Performance monitors
7
To customize the monitor to display data by a selected time frame as well as customize the display
options, refer to
“Editing a preconfigured performance monitor”
Accessing additional data from the Top Port Link Failures monitor
•
Right-click a row in the monitor to access the shortcut menu available for the associated
device. For more information about shortcut menus, refer to
•
Double-click a row to navigate to the SAN Historical Graphs/Tables dialog box. For more
information, refer to
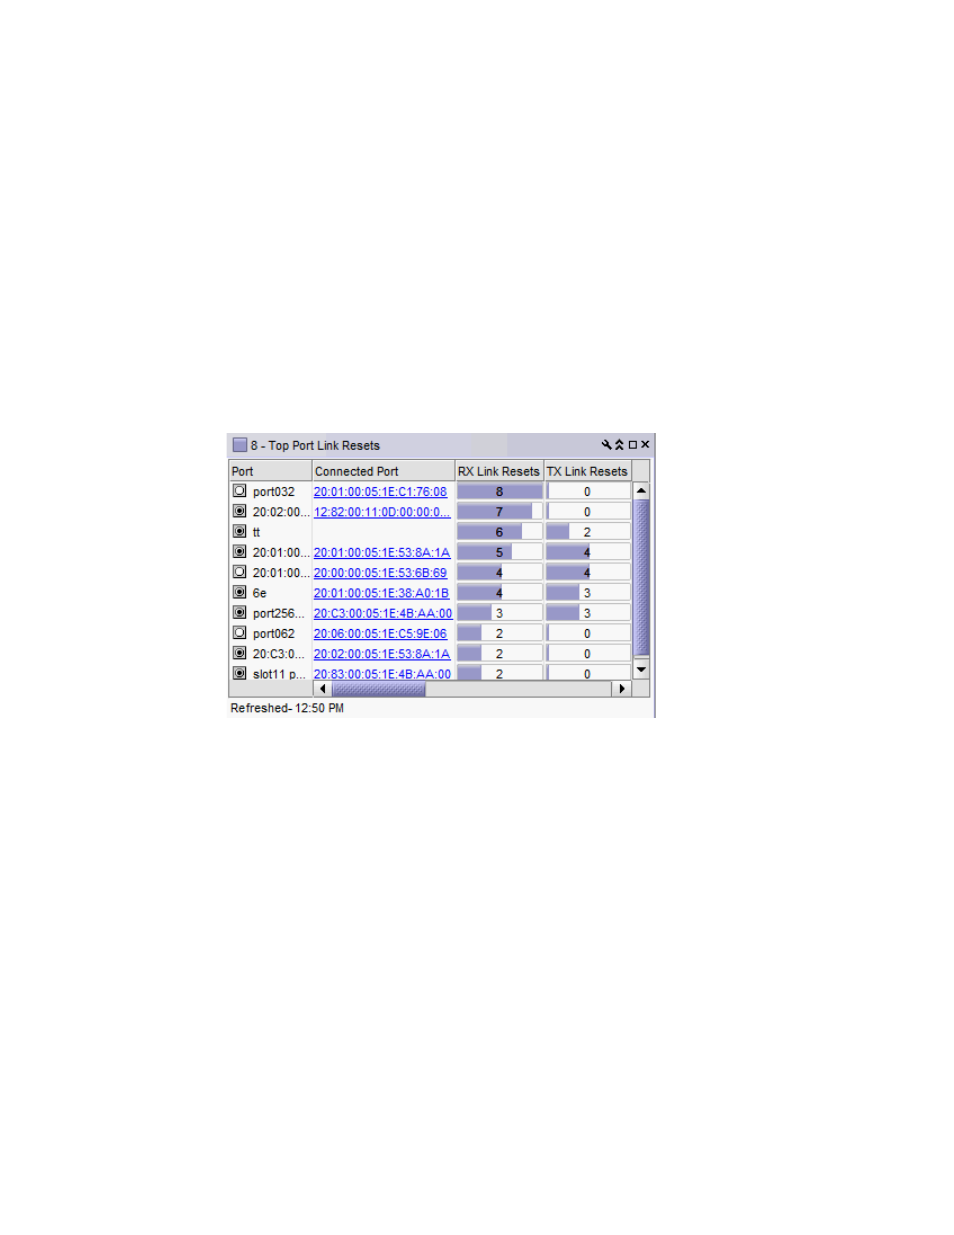
Top Port Link Resets monitor
The Top Port Link Resets monitor (
) displays the top ports with link resets in a table.
FIGURE 132
Top Port Link Resets monitor
The Top Port Link Resets monitor includes the following data:
•
Severity icon/monitor title — The worst severity of the data based on the error count shown
next to the monitor title.
•
Port — The port affected by this monitor.
•
Connected_Port_Link (where Connected_Port_Link is Connected Port, Initiator, or Target) —
Displays one of the following:
-
Connected Port — The ISL or IFL port on the connected device. Click to launch the switch
port properties dialog box.
-
Initiator — The initiator port on the connected device. Click to launch the device properties
dialog box.
-
Target — The target port on the connected device. Click to launch the device properties
dialog box.
•
RX Link Resets /sec — The number (error rate) receive link reset errors per second for the
duration specified in the monitor.
•
RX Link Resets — The number (error count) of receive link reset errors.