Time series performance monitors – Brocade Network Advisor SAN User Manual v12.3.0 User Manual
Page 384
332
Brocade Network Advisor SAN User Manual
53-1003154-01
User-defined performance monitors
7
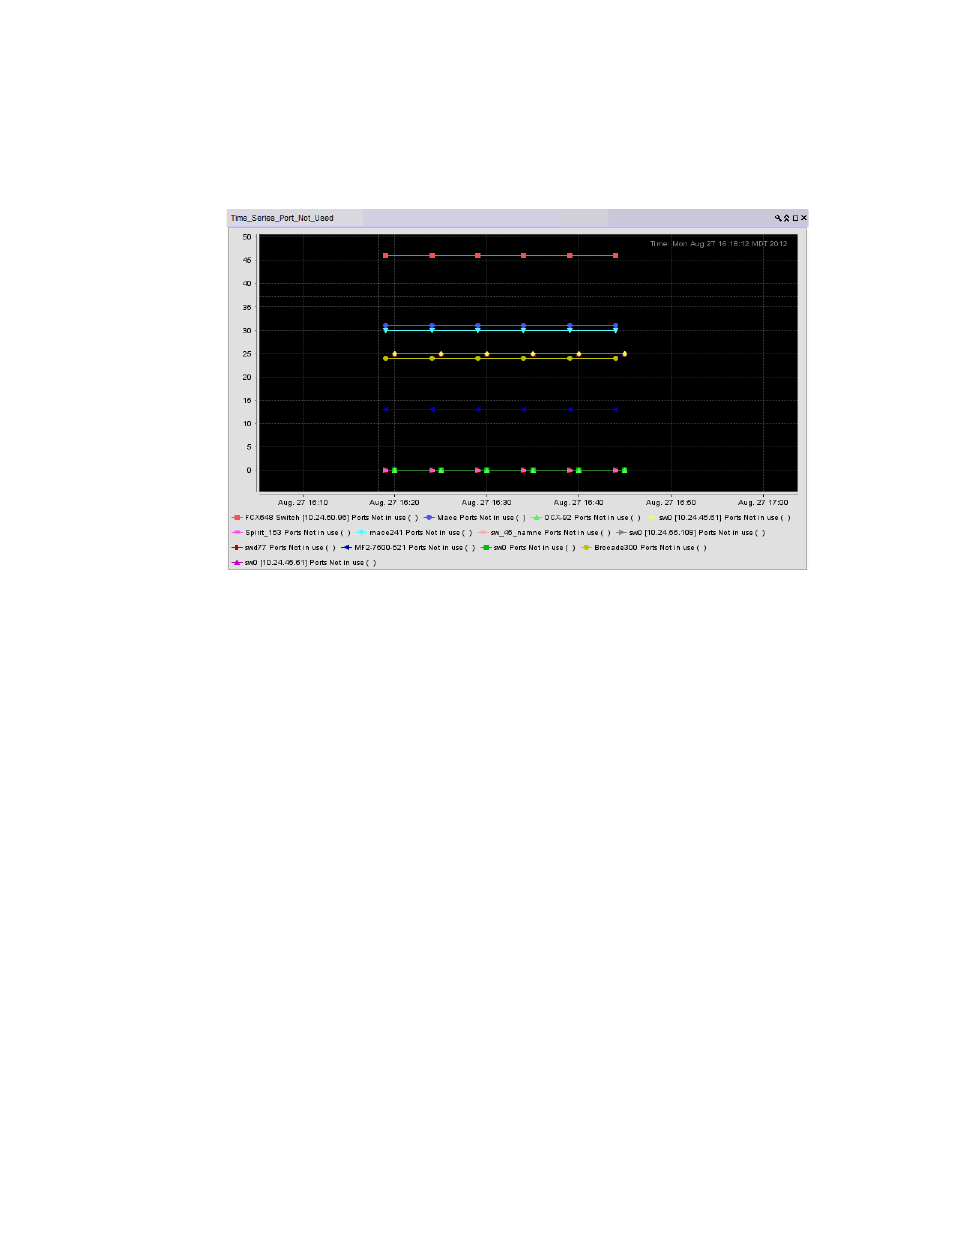
Time series performance monitors
The time series performance monitors (
) display the selected measures in a chart.
FIGURE 146
Time series performance monitor example
The time series performance monitor includes the following data:
•
Monitor title — The user-defined monitor title.
•
Value (y-axis) — The number of objects affected by this monitor.
•
Time (x-axis) — The date and time the monitor collected the data.
•
Legend (below the x-axis) — The line color and the associated data that each line represents.
•
Network Scope — The network scope, such as Local or Published. Displays Local if you select
the targets when creating the monitor. Displays Published if you select the Use Network Scope
check box when creating the monitor.
Place the cursor on a data point in graph line to view details. Place the cursor on an Event icon to
view the event details. Right-click the graph to access the graph shortcut menu (refer to
“Configuring the performance graph display”
To configure a time series performance monitor, refer to
“Configuring a user-defined product