Brocade Network Advisor SAN User Manual v12.3.0 User Manual
Page 260
208
Brocade Network Advisor SAN User Manual
53-1003154-01
Dashboard customization
6
•
Temperature — The top temperatures. Pause on a rown to display the minimum, current, and
maximum vaules for the selected row. This field also displays minimum (black) and maximum
(red) pointers.
•
Fabric — The fabric to which the device belongs.
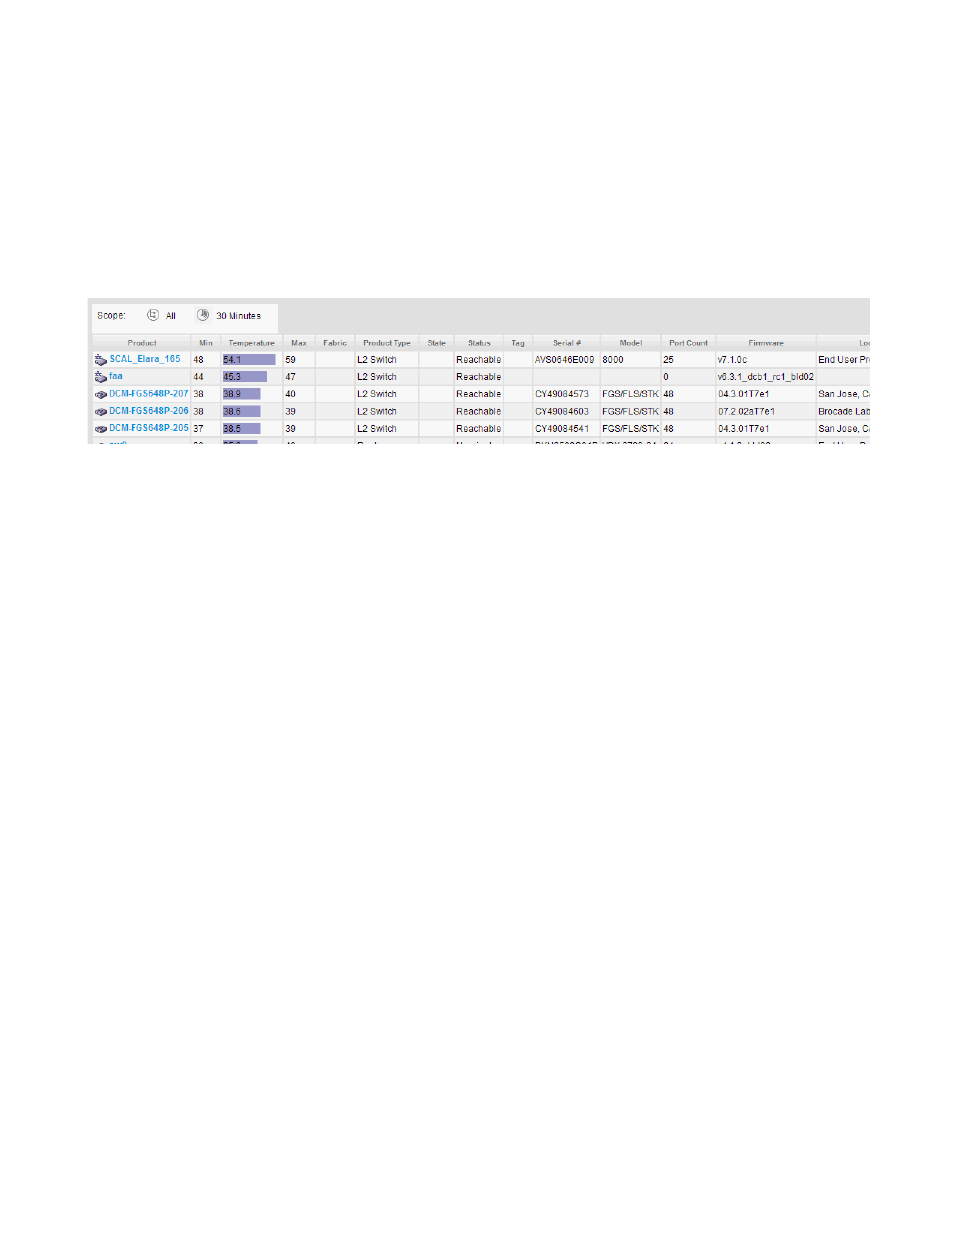
Viewing additional details for the Top Product Temperature monitor
1. Click the View Details icon.
FIGURE 75
Top Product Temperature Detailed View
A more detailed widget displays which includes the following data:
•
Scope — The scope configured for the dashboard.
•
Product — The product affected by this monitor. Click to launch the Product page for this
device (refer to
on page 216). When you launch the Product
page, the detailed view closes.
•
Min — The minimum value of the measure in the specified time range.
•
Temperature — The top temperatures.
•
Max — The maximum value of the measure in the specified time range.
•
Fabric — The fabric to which the device belongs.
•
Product Type — The type of product (for example, switch).
•
State — The product state (for example, Offline).
•
Status — The product status (for example, Reachable).
•
Tag — The product tag.
•
Serial # — The serial number of the product.
•
Model — The product model.
•
Port Count — The number of ports on the product.
•
Firmware — The firmware level running on the product.
•
Location — The location of the product.
•
Contact — A contact name for the product.
2. Click the close (X) button.