Brocade Mobility RFS7000-GR Controller System Reference Guide (Supporting software release 4.1.0.0-040GR and later) User Manual
Page 482
468
Brocade Mobility RFS7000-GR Controller System Reference Guide
53-1001944-01
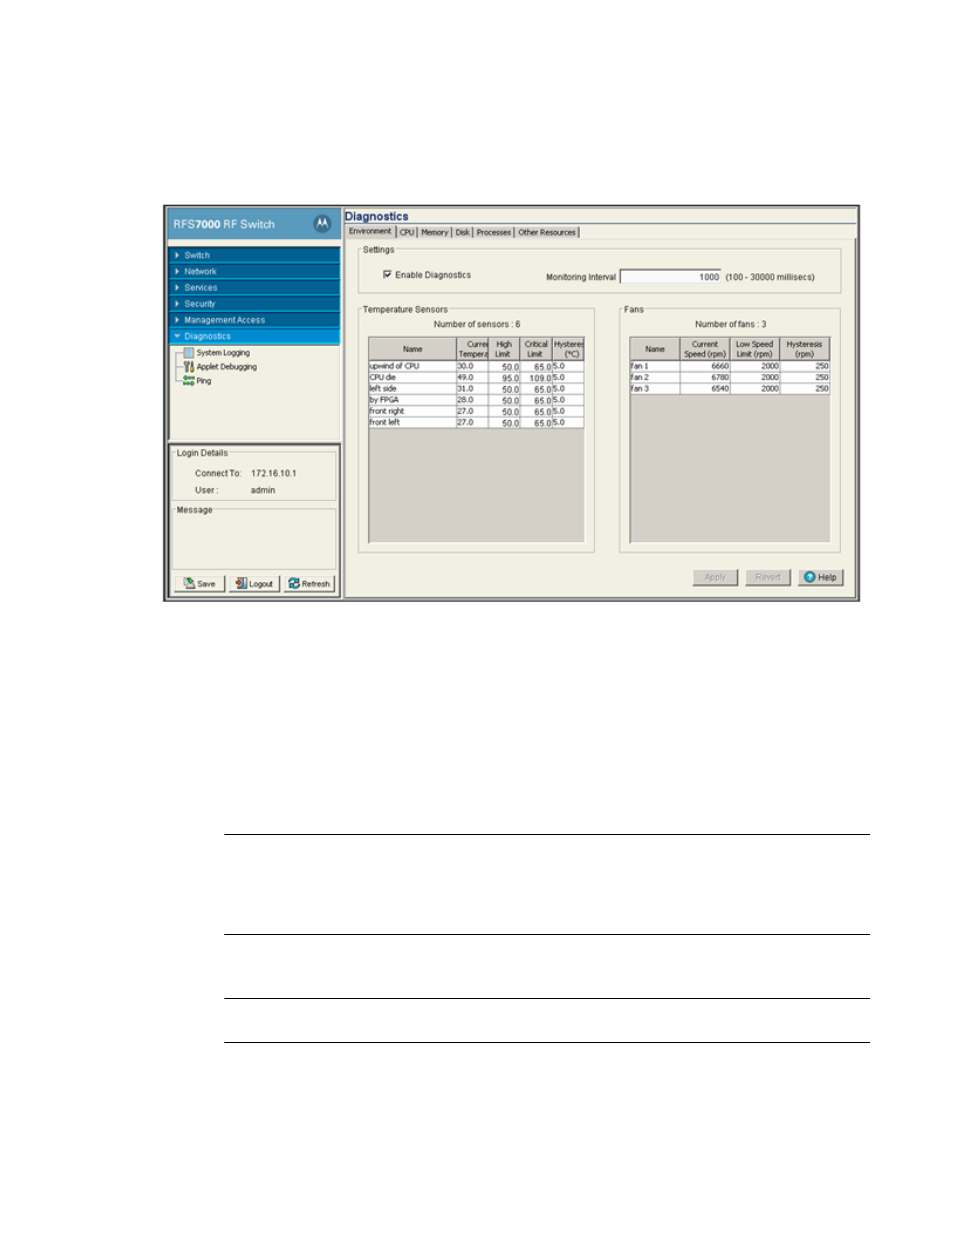
Displaying the main diagnostic interface
8
1. Select Diagnostics from the main tree menu.
2. Select the Environment tab (opened by default).
3. The Environment displays the following fields:
•
Settings
•
Temperature Sensors
•
Fans
4. In the Settings field, select the Enable Diagnostics checkbox to enable/disable diagnostics
and set the monitoring interval. The monitoring interval is the interval the switch uses to
update the information displayed within the CPU, Memory, Disk, Processes and Other
Resources tabs. Keep the monitoring interval at a shorter time increment when periods of
heavy wireless traffic are anticipated.
NOTE
Enabling switch diagnostics is recommended, as the diagnostics facilities provide detailed
information on the physical performance of the switch and may provide indicators in advance of
actual problems. Enabling diagnostics also assists in troubleshooting problems associated with
data transfers and the monitoring of network traffic.
5. Use the Temperature Sensors field to monitor the CPU and system temperatures. This
information is extremely useful in assessing if the switch exceeds its critical limits.
NOTE
A Brocade Mobiltiy RFS7000-GR ControllerSeries Switch has six sensors.
6. Refer to the Fans field to monitor the CPU and system fan speeds.
7. Click the Apply button to commit and apply the changes.