View a mu statistics graph – Brocade Mobility RFS7000-GR Controller System Reference Guide (Supporting software release 4.1.0.0-040GR and later) User Manual
Page 174
160
Brocade Mobility RFS7000-GR Controller System Reference Guide
53-1001944-01
Viewing associated MU details
4
8. Refer to the Status field for the current state of the requests made from applet. This field
displays error messages if something goes wrong in the transaction between the applet and
the switch.
9. Click Cancel to close the dialog without committing updates to the running configuration.
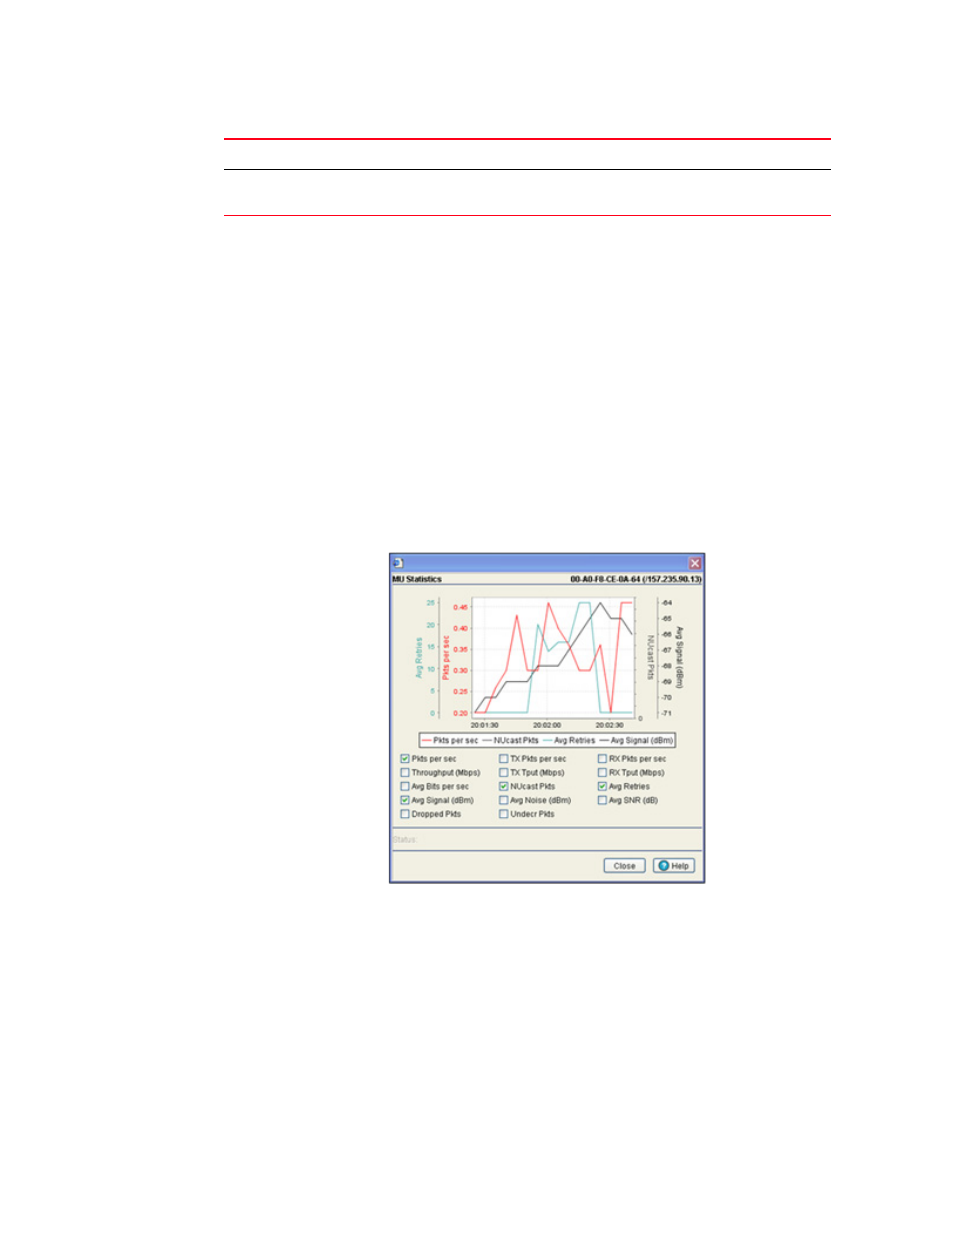
View a MU statistics graph
The MU Statistics tab has an option for displaying detailed MU statistics for individual MUs in a
graphical format. This information can be used for comparison purposes to chart MU and overall
switch performance.
To view the MU Statistics in a graphical format:
1. Select a Network > Mobile Units from the main menu tree.
2. Click the Statistics tab.
3. Select a MU from the table displayed in the Statistics screen and click the Graph button.
4. Select a checkbox to display that metric charted within the graph. Do not select more than four
checkboxes at any one time.
5. Refer to the Status field for the current state of the requests made from applet. This field
displays error messages if something goes wrong in the transaction between the applet and
the switch.
6. Click Close to close the dialog without committing updates to the running configuration.
% Gave Up Pkts
Displays the percentage of packets the switch gave up on for the selected MU.
% of Undecryptable
Pkts
Displays the percentage of undecryptable packets (packets that could not be
processed) for the selected MU.