Understanding how to read histograms, Histograms overview, 344 understanding how to read histograms 344 – Apple Aperture 3.5 User Manual
Page 344
Chapter 7
Make image adjustments
344
Adjustments
Color clipping information
Black Point parameter (Exposure adjustment)
Black Levels parameter (Levels adjustment)
•
White: Indicates no shadow clipping in any
color channel.
•
66% gray: Indicates shadow clipping in one
color channel.
•
33% gray: Indicates shadow clipping in two
color channels.
•
Black: Indicates shadow clipping in all three
color channels.
Understanding how to read histograms
Histograms overview
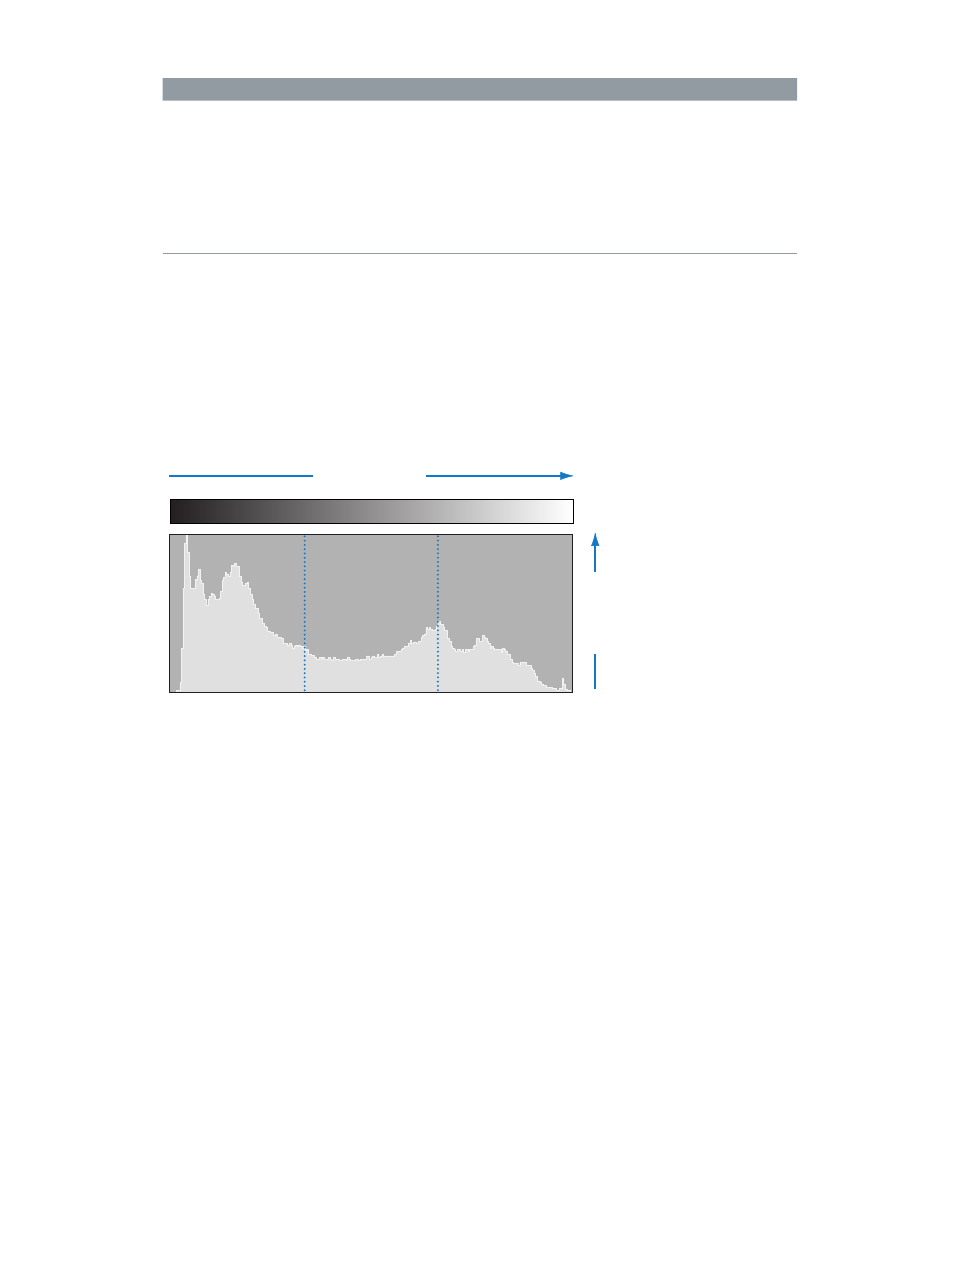
The histogram is a graph that displays relative brightness in an image, from pure black to pure
white. The area under the graph represents all the pixels in the image. From left to right, the
histogram describes the range of dark pixels (shadows), gray pixels (midtones), and bright pixels
(highlights) in the image. The shape of the histogram graph depends on the tonality of the scene
and the exposure.
Pixels increase
Shadows
Highlights
Midtones
Brightness increases
A histogram can also be used as a tool to evaluate whether there’s enough shadow, midtone,
and highlight information in the image. Aperture provides three histograms in the Adjustments
inspector and the Adjustments pane of the Inspector HUD:
•
The histogram above the adjustment controls indicates the current state of the image.
•
The Levels histogram included with the Levels adjustment controls provides a way to adjust
the brightness values in the image in relation to the displayed histogram. You use the Levels
controls to adjust the shadow, dark quarter-tone, midtone, light quarter-tone, and highlight
values independently of one another without affecting the other areas of the image.
For information about performing a Levels adjustment, see
on
page 295.
•
The Curves histogram included with the Curves adjustment controls provides a way to adjust
the tonal values in the image in relation to the displayed histogram. You use the Curves
controls to adjust the full range of tonal values independently of one another without
affecting the other areas of the image.
For information about performing a Curves adjustment, see
on page 282.
67% resize factor