Example 3: shading between two pens, Setting up snapshots and overlays, Setting up snapshots and overlays – 19 – Rockwell Automation FactoryTalk View Site Edition Users Guide User Manual
Page 615
23
•
S
ETTING
UP
TRENDS
23–19
•
•
•
• •
23
•
Pla
ceho
lde
r
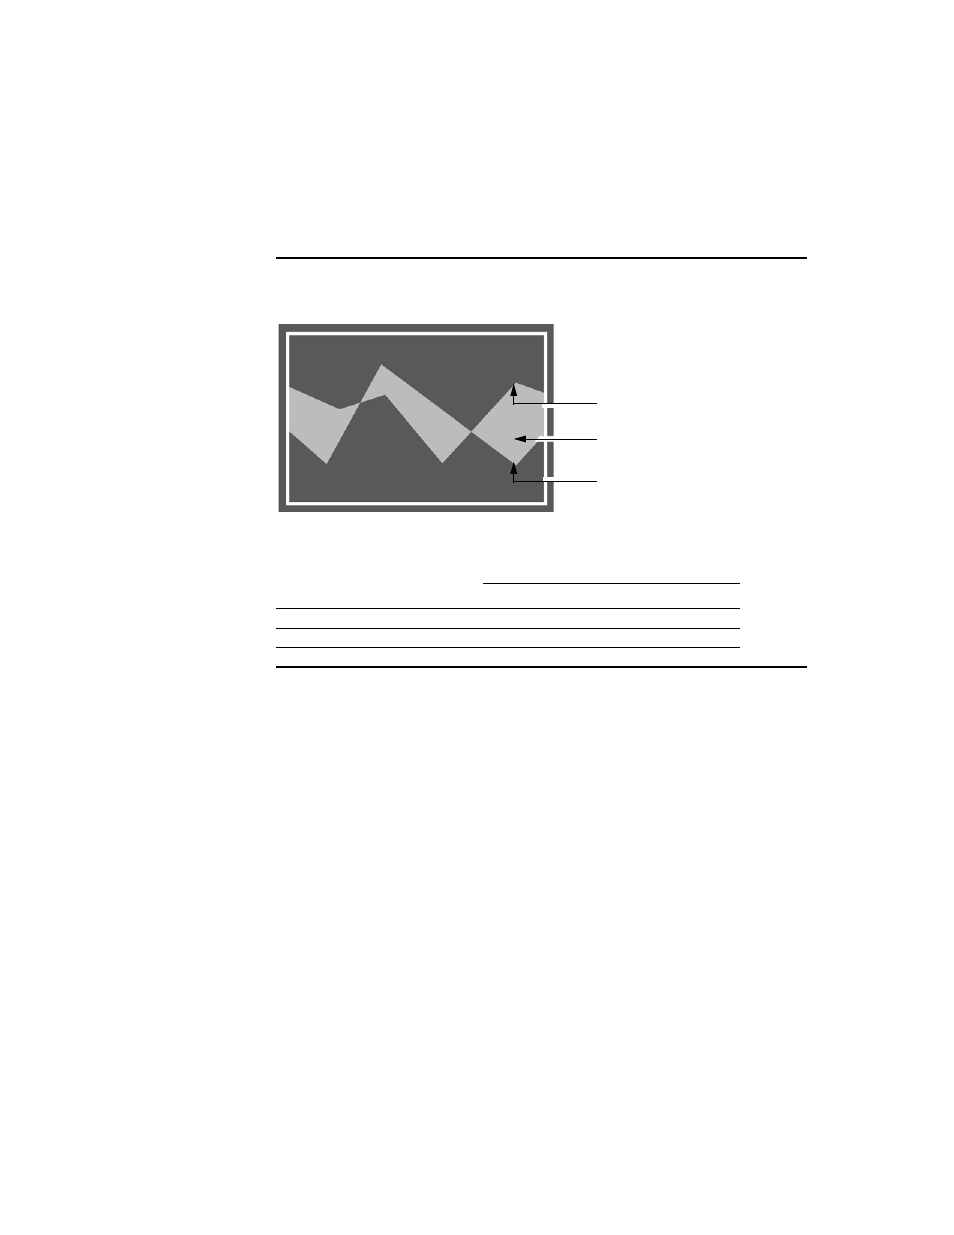
Example 3: Shading between two pens
Whenever Pen 1 goes above or below Pen 2, the trend is shaded like this:
To produce the shading shown in the illustration, use the following settings:
Using overlays to compare real-time and historical data
You can layer a trend with a snapshot of previously charted data. This is called an overlay.
Use overlays to compare current charted data to a historical snapshot. For example, you
might set up overlays to compare data for a particular shift or batch process.
Setting up snapshots and overlays
To create an overlay, create the data snapshot first, and then add the snapshot as an
overlay, to the trend charting current data.
When you add a snapshot to a trend as an overlay, the pens from the snapshot are added
automatically to the Pens tab in the Trend Properties dialog box. You can change the
attributes of pens used in overlays, just as you can change the attributes of regular pens.
An operator can show or hide overlays on the trend chart at run time, using the trend’s
shortcut menu. For more information, see page 23-30.
Pen
Tag name or Constant
value
Shading
Upper Bound
Lower Bound
Pen 1
VIN_LEVEL
Pen 2
Pen 2
Pen 2
OIL_LEVEL
Color 1
Pen 1
Pen 2