Showing a line legend, Using shading to compare pens, Showing a line legend – 16 – Rockwell Automation FactoryTalk View Site Edition Users Guide User Manual
Page 612: Using shading to compare pens – 16
F
ACTORY
T
ALK
V
IEW
S
ITE
E
DITION
U
SER
’
S
G
UIDE
23–16
• •
•
•
•
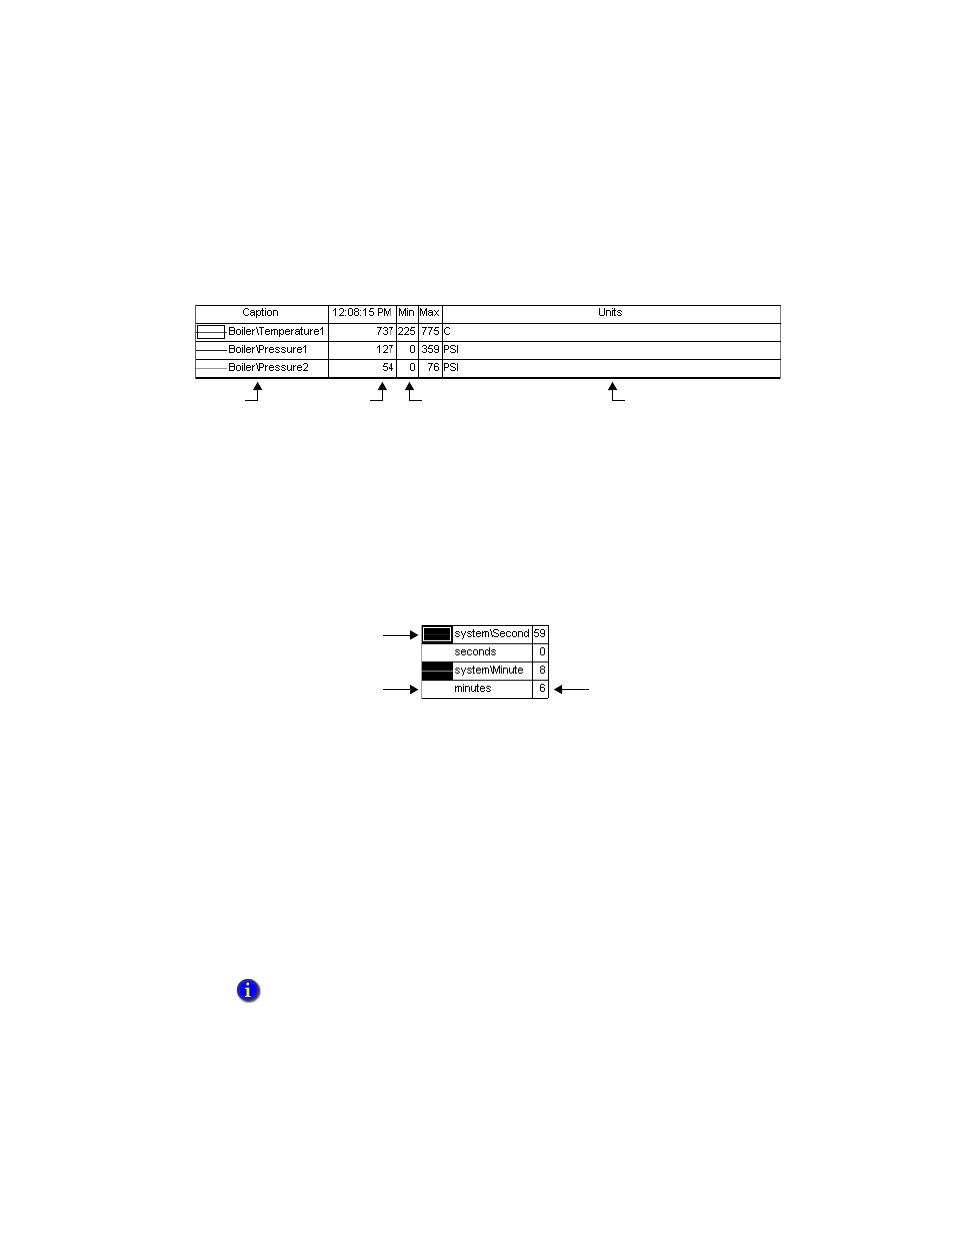
When the line legend is shown at the bottom of the trend chart, the current value legend is
shown as a column in the line legend, as shown in the following illustration.
Showing a line legend
The line legend shows the details of a pen line, including the line color, pen name, the
minimum and maximum values, and the engineering units.
The line legend’s appearance differs depending on where it is located relative to the trend
chart. The previous illustration shows the line legend as it appears at the bottom of the
trend.
The following illustration shows the line legend as it appears to the left of the trend:
Using shading to compare pens
To compare the values of two or more pens in a trend, use shading in the trend.
For example, you can set up Pen 1 to show a tag’s value, and Pen 2 to show a constant
value that is an alarm threshold.
If Pen 2 is the upper boundary for Pen 1, the shading will indicate when the tag’s value
exceeds the threshold, by filling in the area between the two pens with the line color for
Pen 1.
At least two pens must be set up for a trend, before you can use shading.
Set up shading in the Pens tab in the Trend Properties dialog box. For details about
options in the Pens tab, click Help.
Shading is determined by the position of lines on the trend chart—not by the actual tag values.
Pen caption
Current value
legend
Min/max values
Engineering
units
Pen caption
Engineering units
Min/max values