Pen icons, Pen markers, Pen icons – 9 pen markers – 9 – Rockwell Automation FactoryTalk View Site Edition Users Guide User Manual
Page 605
23
•
S
ETTING
UP
TRENDS
23–9
•
•
•
• •
23
•
Pla
ceho
lde
r
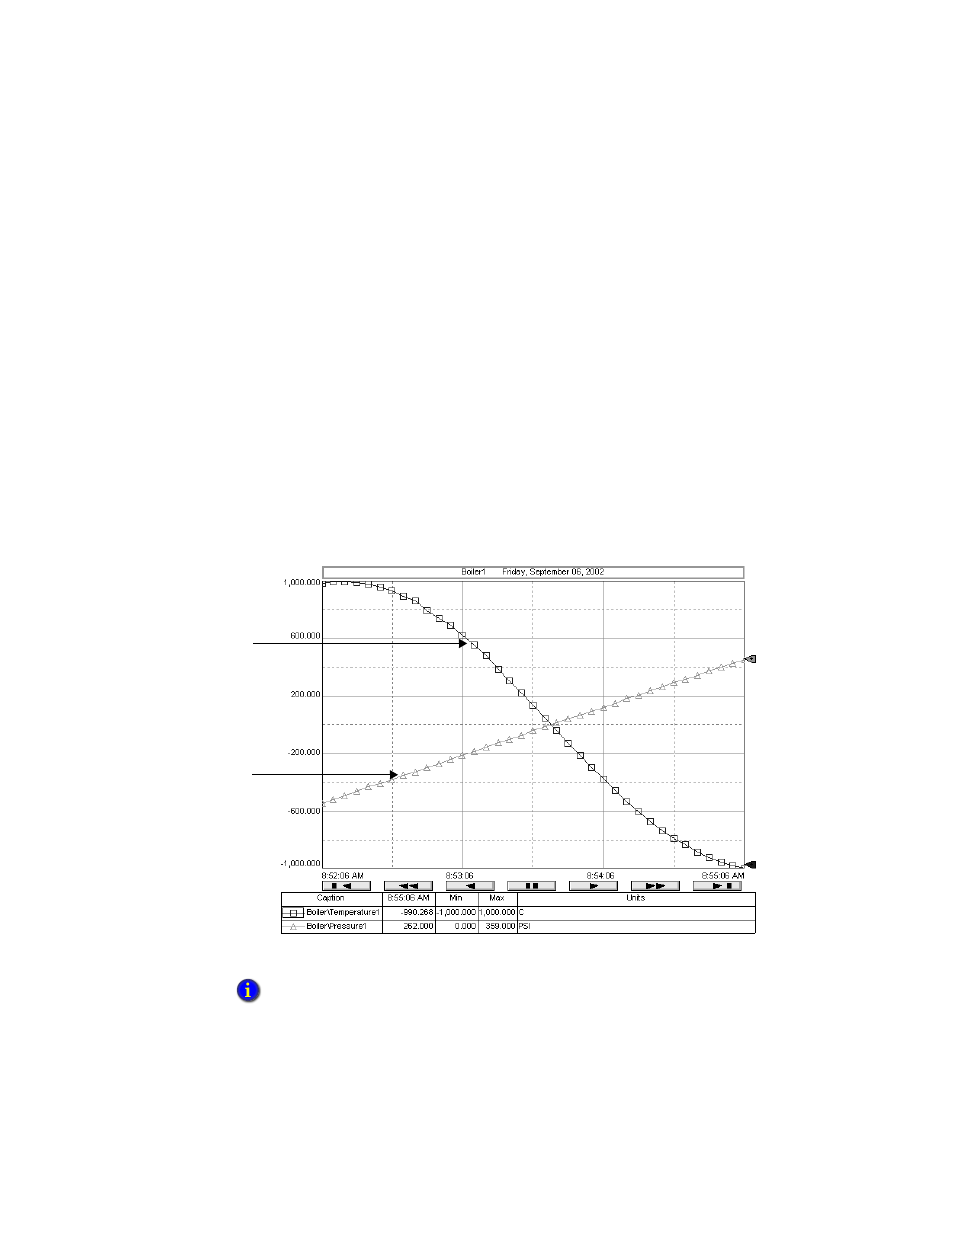
Pen icons
Pen icons, if specified, are shown at the right edge of the trend chart.
At run time, if a pen’s current value is within the scale shown on the vertical axis, the
pen’s icon is shown.
The position of the icon indicates the pen’s most recently recorded value, even if the trend
is paused, or if the most recent value has not yet been plotted.
Pen markers
As shown in the next illustration, pen markers are symbols that indicate data points. A
data point is the exact position of a value plotted on a trend chart.
You can use pen markers to show when data is sampled. For example, when the trend is
updated as the value changes, the pen marker indicates when the trend is updated.
You can also use pen markers to read pen values at run time.
If data is plotted frequently, the markers might not show as distinct, separate symbols on the
trend chart.
A ‘boxed’ pen
marker
An ‘Up triangle’ pen
marker
- 20P PowerFlex DC Drive - Frame D Bimetal Thermostat (10 pages)
- 1336S_F_T_E_R F Frame Snubber Resistor Repl. (6 pages)
- 22-COMM PowerFlex 4-Class DSI (Drive Serial Interface) Network Communication Adapter (4 pages)
- 8-545 Plug In Solid State Relay (2 pages)
- 20-HIM-B1 PowerFlex 7-Class HIM Bezel (DPI) (4 pages)
- 100 Contactors with DC Coil (2 pages)
- 100 Contactors with DC Coil (1 page)
- 20P PowerFlex DC Drive - Frame D Switching Power Supply Circuit Board (6 pages)
- 140G-MTFx_MTHx_MTIx_MTKx Trip Unit Installation-140G-M (6 pages)
- 45BRD Analog Laser Sensor (4 pages)
- 20D Multi-Device Interface Option Board for PowerFlex 700S Drives (20 pages)
- 56RF RFID 18 mm Cylindrical Transceiver (2 pages)
- 42KC Miniature Rectangular: 5V DC Version (2 pages)
- 20P PowerFlex DC Drive - Frame A Switching Power Supply Circuit Board (16 pages)
- 21P-MISC-A-TP-2 Transition Tube Kit #C19-6/7 For PowerFlex 755 w/OEM Liquid Cooling Fr 6/7 Drive (2 pages)
- 42BT Background Suppression Sensor (3 pages)
- 42CB High Speed 18mm Cylindrical (4 pages)
- 140EX-JE2_JE3 Molded Case Circuit Breaker (4 pages)
- 140G-K-EAM1A Early Make Aux Contact for Rotary Handle Oper Mech-140G-K (1 page)
- 140G-K-EAM1A Early Make Aux Contact for Rotary Handle Oper Mech-140G-K (3 pages)
- 20-HIM-A6 PowerFlex (Human Interface Module) (74 pages)
- 42CF General Purpose 12mm Cylindrical (4 pages)
- 20D PowerFlex 700S Phase II Drive Frames 1...6 (80 pages)
- 140EX-HE1_HE2 Molded Case Circuit Breaker (6 pages)
- 140EX-HE1_HE2 Molded Case Circuit Breaker (4 pages)
- 20B PowerFlex 700 Custom Firmware - Pump Off (12 pages)
- 20-WIM-N4S DPI Wireless Interface Module (92 pages)
- 140U H-Frame Circuit Breaker Fixed and Adjustable Thermal Trip (2 pages)
- 140U H-Frame Circuit Breaker Fixed and Adjustable Thermal Trip (7 pages)
- 60-2619, 42JS Swivel/Tilt Mounting Bracket (1 page)
- 22A PowerFlex 4/40/400 Flange Mount (4 pages)
- 45MLA Controller Installation Instructions (16 pages)
- 20P PowerFlex DC Drive - Cooling Fan for Frame A Drives Above 73A at 230V 460V AC (6 pages)
- 42JS Series 7000 to 42JS VisiSight Replacement Kit (2 pages)
- 22A PowerFlex 4-Class HIM Bezel (DSI) (4 pages)
- 42CS Stainless Steel Photoelectric Sensors (4 pages)
- 20L-LL PowerFlex 700L Liquid-to-Liquid Heat Exchanger (40 pages)
- 20P PowerFlex DC Drive - Frame B SCR Modules (20 pages)
- 22B PowerFlex 40 Quick Start FRN 5.xx - 6.xx (161 pages)
- 22B PowerFlex 40 Quick Start FRN 5.xx - 6.xx (22 pages)
- 22F PowerFlex 4M Input RFI Filters (2 pages)
- 45LFM Capacitive Label Sensor (4 pages)
- 140G-Rx Installation Instruction-140G-R (2 pages)
- 140G-Rx Installation Instruction-140G-R (29 pages)
- 22C PowerFlex 400 AC Drive Quick Start - FRN 1-4.xx (28 pages)