Rockwell Automation FactoryTalk View Site Edition Users Guide User Manual
Page 609
23
•
S
ETTING
UP
TRENDS
23–13
•
•
•
• •
23
•
Pla
ceho
lde
r
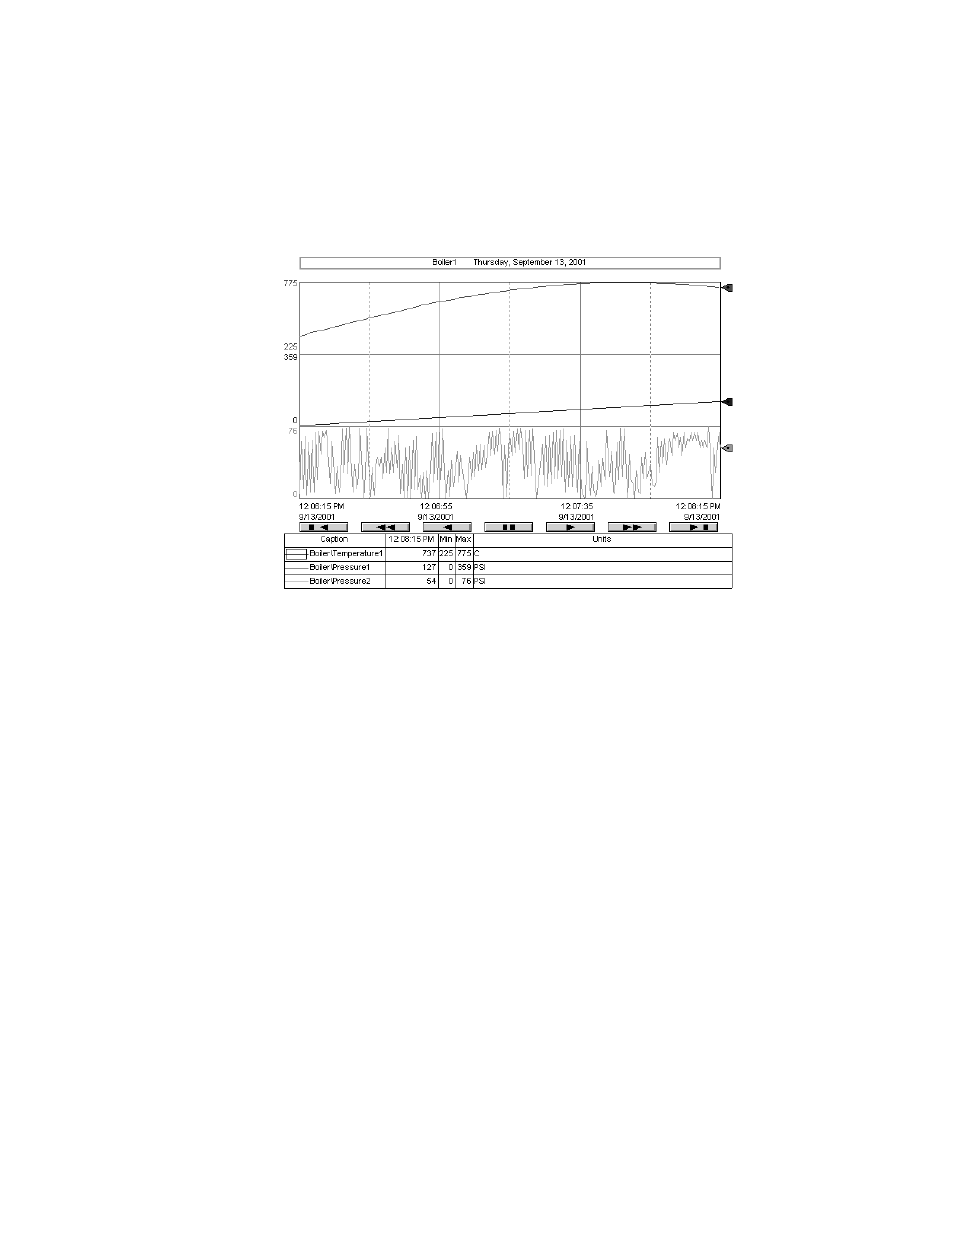
Plotting a value across the full width of the chart
Use horizontal lines on a trend chart to provide an orientation for your tag data.
For example, you can define upper and lower limits for a tag’s value, and then show the
limits as horizontal lines in the trend. When the value crosses one of the limits, the tag’s
condition is obvious on the trend.
The vertical position the pen in the trend depends on value of the tag, expression, or
constant used to define the pen. If the value changes, the position of the horizontal line
also changes.
To plot a constant value across the chart’s full width
1. In the Trend Properties dialog box, click the Pens tab.
2. Add a pen with a constant value.
When values for the pen are plotted across the full width of the chart, the pen shows as a
solid horizontal line.
To plot a tag or expression across the chart’s full width
1. In the Trend Properties dialog box, click the Pens tab.
2. Add a pen with a tag or expression that will determine the position of the pen line.
- 20P PowerFlex DC Drive - Frame D Bimetal Thermostat (10 pages)
- 1336S_F_T_E_R F Frame Snubber Resistor Repl. (6 pages)
- 22-COMM PowerFlex 4-Class DSI (Drive Serial Interface) Network Communication Adapter (4 pages)
- 8-545 Plug In Solid State Relay (2 pages)
- 20-HIM-B1 PowerFlex 7-Class HIM Bezel (DPI) (4 pages)
- 100 Contactors with DC Coil (2 pages)
- 100 Contactors with DC Coil (1 page)
- 20P PowerFlex DC Drive - Frame D Switching Power Supply Circuit Board (6 pages)
- 140G-MTFx_MTHx_MTIx_MTKx Trip Unit Installation-140G-M (6 pages)
- 45BRD Analog Laser Sensor (4 pages)
- 20D Multi-Device Interface Option Board for PowerFlex 700S Drives (20 pages)
- 56RF RFID 18 mm Cylindrical Transceiver (2 pages)
- 42KC Miniature Rectangular: 5V DC Version (2 pages)
- 20P PowerFlex DC Drive - Frame A Switching Power Supply Circuit Board (16 pages)
- 21P-MISC-A-TP-2 Transition Tube Kit #C19-6/7 For PowerFlex 755 w/OEM Liquid Cooling Fr 6/7 Drive (2 pages)
- 42BT Background Suppression Sensor (3 pages)
- 42CB High Speed 18mm Cylindrical (4 pages)
- 140EX-JE2_JE3 Molded Case Circuit Breaker (4 pages)
- 140G-K-EAM1A Early Make Aux Contact for Rotary Handle Oper Mech-140G-K (1 page)
- 140G-K-EAM1A Early Make Aux Contact for Rotary Handle Oper Mech-140G-K (3 pages)
- 20-HIM-A6 PowerFlex (Human Interface Module) (74 pages)
- 42CF General Purpose 12mm Cylindrical (4 pages)
- 20D PowerFlex 700S Phase II Drive Frames 1...6 (80 pages)
- 140EX-HE1_HE2 Molded Case Circuit Breaker (6 pages)
- 140EX-HE1_HE2 Molded Case Circuit Breaker (4 pages)
- 20B PowerFlex 700 Custom Firmware - Pump Off (12 pages)
- 20-WIM-N4S DPI Wireless Interface Module (92 pages)
- 140U H-Frame Circuit Breaker Fixed and Adjustable Thermal Trip (2 pages)
- 140U H-Frame Circuit Breaker Fixed and Adjustable Thermal Trip (7 pages)
- 60-2619, 42JS Swivel/Tilt Mounting Bracket (1 page)
- 22A PowerFlex 4/40/400 Flange Mount (4 pages)
- 45MLA Controller Installation Instructions (16 pages)
- 20P PowerFlex DC Drive - Cooling Fan for Frame A Drives Above 73A at 230V 460V AC (6 pages)
- 42JS Series 7000 to 42JS VisiSight Replacement Kit (2 pages)
- 22A PowerFlex 4-Class HIM Bezel (DSI) (4 pages)
- 42CS Stainless Steel Photoelectric Sensors (4 pages)
- 20L-LL PowerFlex 700L Liquid-to-Liquid Heat Exchanger (40 pages)
- 20P PowerFlex DC Drive - Frame B SCR Modules (20 pages)
- 22B PowerFlex 40 Quick Start FRN 5.xx - 6.xx (161 pages)
- 22B PowerFlex 40 Quick Start FRN 5.xx - 6.xx (22 pages)
- 22F PowerFlex 4M Input RFI Filters (2 pages)
- 45LFM Capacitive Label Sensor (4 pages)
- 140G-Rx Installation Instruction-140G-R (2 pages)
- 140G-Rx Installation Instruction-140G-R (29 pages)
- 22C PowerFlex 400 AC Drive Quick Start - FRN 1-4.xx (28 pages)