Customizing the events widget, Accessing additional data from the events widget – Brocade Network Advisor IP User Manual v12.3.0 User Manual
Page 385
Brocade Network Advisor IP User Manual
333
53-1003153-01
Status widgets
8
•
Bar chart — The event severity using the color codes in
•
Network Scope — Select to display the events count of the products present in the selected
network scope.
•
Time Scope — Select to display the events count of the products present in the selected time
range and duration.
NOTE
Application events excluding object level are displayed only if All is selected in the Network Scope.
The Events widget only includes events from products that are in your AOR.
The x-axis represents the number of occurrences of a particular event severity during the selected
time period. If you pause on a bar, a tooltip shows the number of events with that severity level
during the selected time period. Also, for each severity, the cumulative number of traps, application
events, and security events is reported next to the horizontal bar. If Syslog messages are included,
then they are included in the count. To conserve space, the number is shown as is or truncated to
the nearest 1,000 ("K") or 1,000,000 ("M").
By default, Syslog events are included in the summary; however, because Syslog events occur at a
much higher frequency than other events and therefore could skew the bars for the other events,
you can exclude Syslog events. If they are excluded, they will not be displayed in the legend. Users’
selections are persisted (per user per server).
Customizing the Events widget
You can customize the Events widget to display events for a specific network scope and time scope
to display Syslog details.
•
Include Syslog information (default) on the Event Summary pane by selecting the Show Syslog
check box. To exclude Syslog information, clear the Show Syslog check box.
•
To display data for a specific fabric or group, refer to
Accessing additional data from the Events widget
Double-click a bar in the Events widget to navigate to an event custom report (HTML) that displays
the events corresponding to the network scope and time scope selected.
For information about report details, refer to
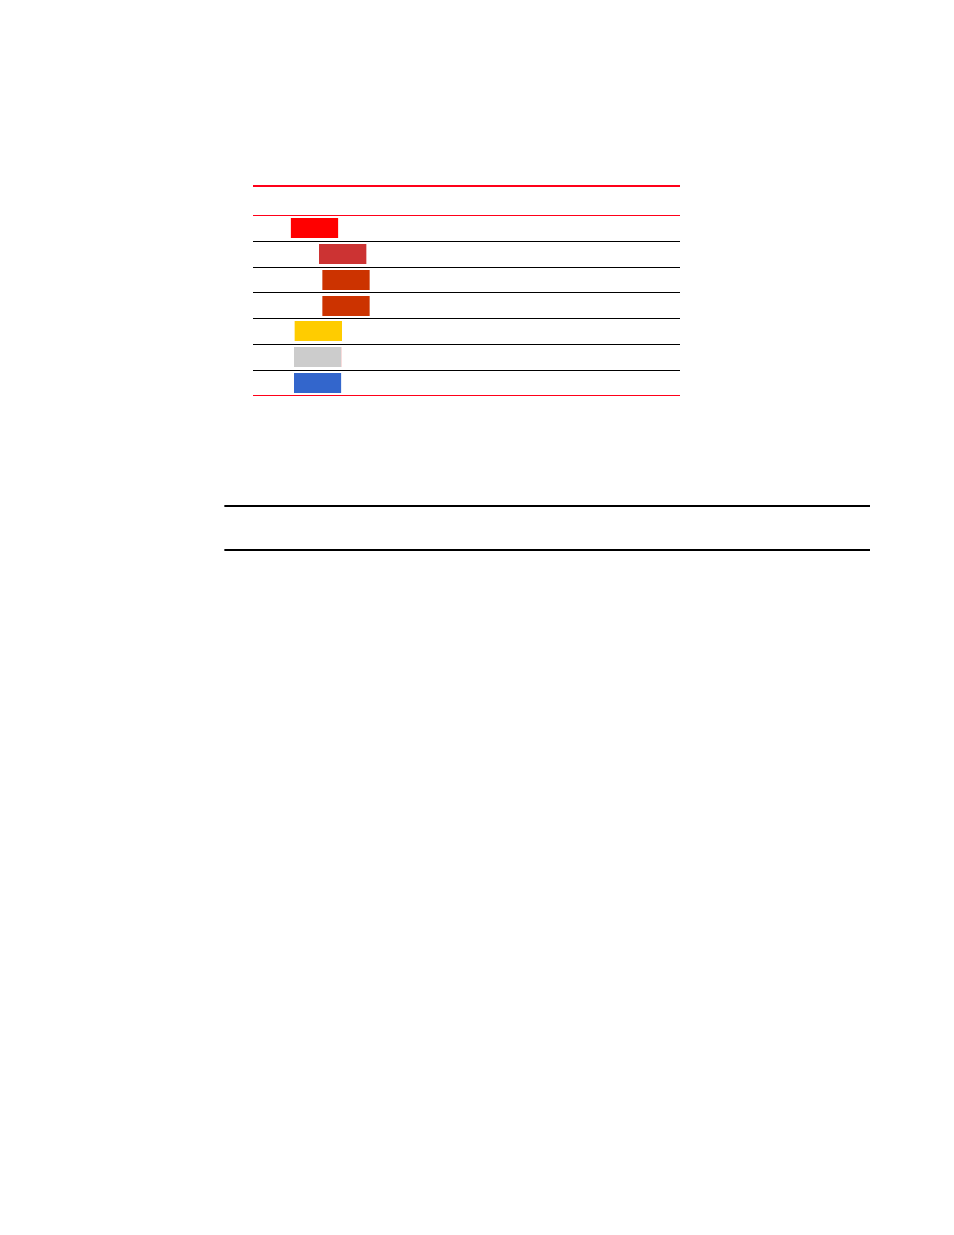
TABLE 30
Event severity color codes
Color
Severity
Red
(
)
Emergency
Brick Red
(
)
Alert
Brick Red
(
)
Critical
Brick Red
(
)
Error
Gold
(
)
Warning
Grey
(
)
Notice
Blue
(
)
Info