Brocade Network Advisor IP User Manual v12.3.0 User Manual
Page 331
Brocade Network Advisor IP User Manual
277
53-1003153-01
Inventory
7
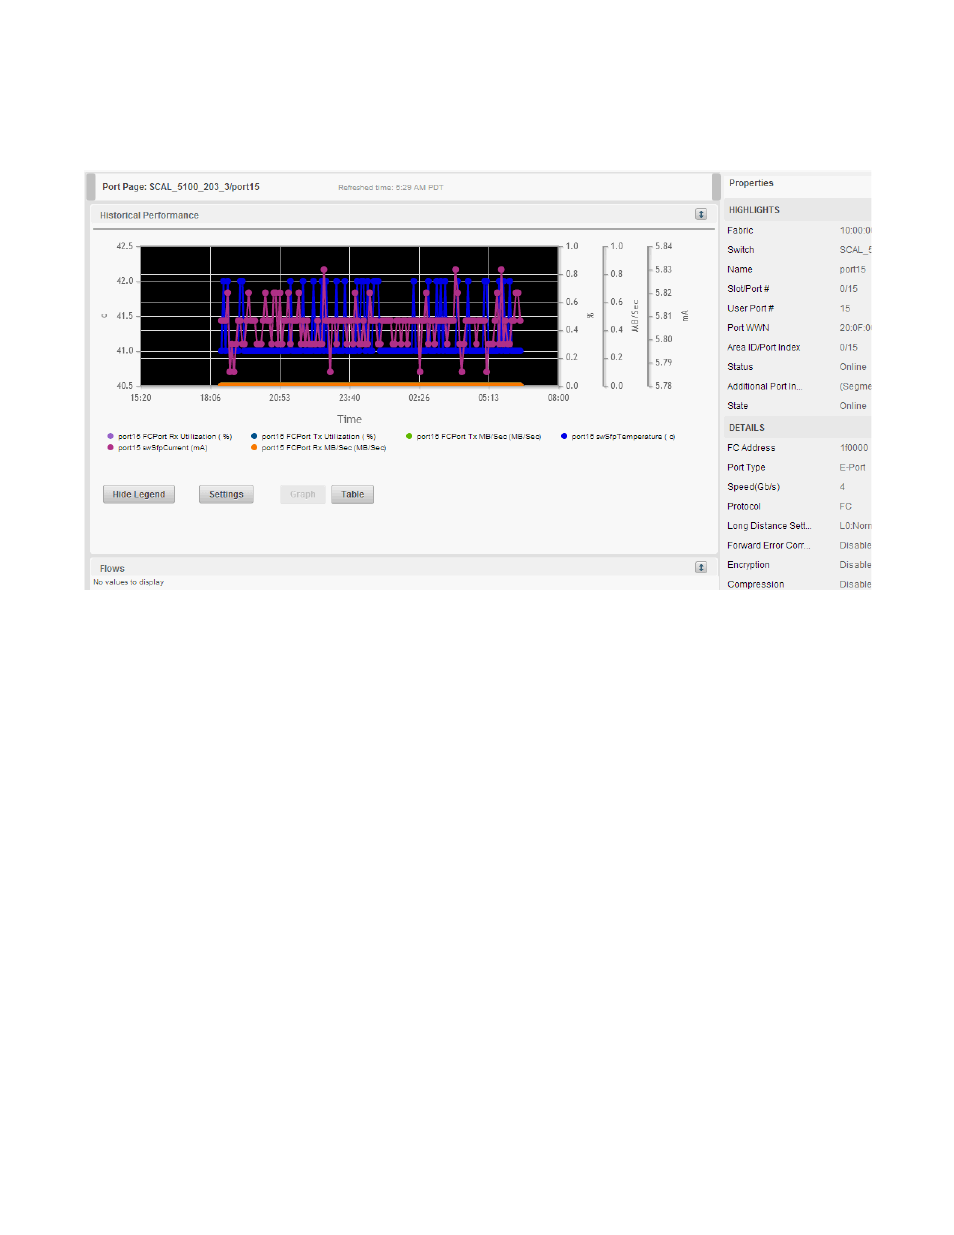
The port summary displays with two panes: Port Page and Properties.
FIGURE 120
Port summary
4. Review the port summary data.
The Ports Details area displays the following data for the selected product:
•
Collapse/Expand button — Click to collapse or expand the view.
•
Performance graph/table — Displays the performance data when configured. To configure
a graph or table, refer to
“Configuring a port measure performance graph”
•
Show/Hide Legend button — Click to show or hide the performance graph legend.
•
Settings button — Click to change the port measure selection you want to include in the
graph or table or to change the time scope for the graph or table.
•
Graph button — Click to show the performance data in a graph. The x-axis displays the time
scope you selected. The y-axis display depends on the performance measure you selected.
If you have not selected performance measures, the graph displays receive and transmit
utilization measures by default.