Brocade Network Advisor IP User Manual v12.3.0 User Manual
Page 1159
Brocade Network Advisor IP User Manual
1107
53-1003153-01
SAN real-time performance data
34
1. Select the fabric, device, or port for which you want to generate a performance graph.
Right-click and select Performance > Real-Time Graph/Table or select Monitor > Performance
> Real-Time Graph. The Real Time Graphs/Tables dialog box displays.
If you selected a port, the Real Time Performance Graphs dialog box for the selected port
displays. To filter real-time performance data from the Real Time Performance Graphs dialog
box, refer to
“Filtering real-time performance data”
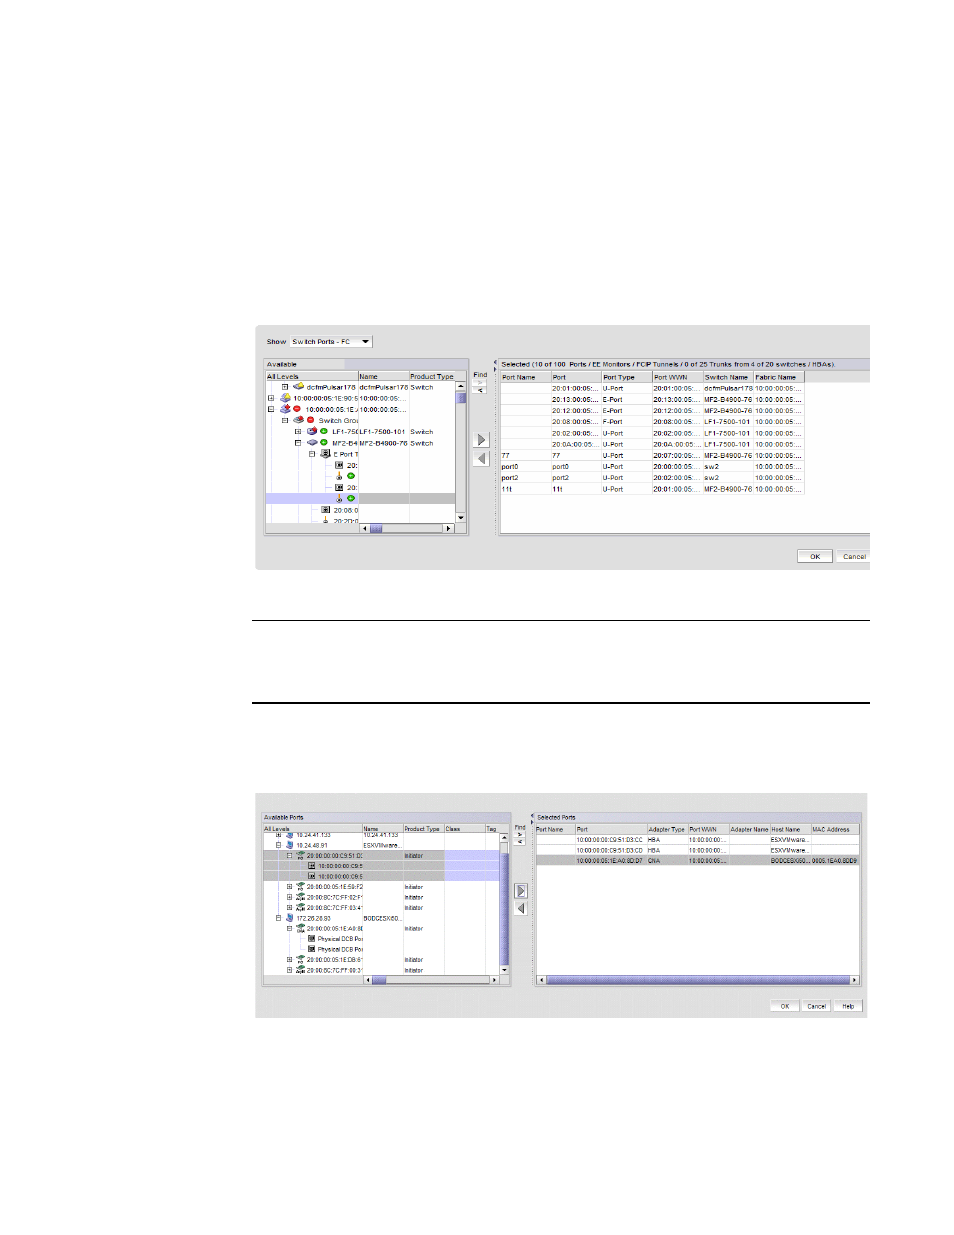
If you selected a fabric or a device, the Realtime Port Selector dialog box displays, as shown in
FIGURE 463
Realtime Port Selector dialog box
NOTE
You can set columns in the right side of the dialog box for FICON display using Server > Options
> SAN Display. The first eight columns will display FC Address, Serial #, Tag, Product Type,
Model, Vendor, Port Name, Port Type, and Port WWN.
If you selected a host adapter, the Realtime Port Selector - Hosts dialog box displays with all
the managed HBA and CNA ports of the discovered hosts, as shown in
. Continue
with
FIGURE 464
Realtime Port Selector - Hosts dialog box
2. From the Show list, select the object type for which you want to performance graph.