Step 3, Figure 466 – Brocade Network Advisor IP User Manual v12.3.0 User Manual
Page 1173
Brocade Network Advisor IP User Manual
1121
53-1003153-01
IP real-time performance monitoring
34
-
Unit / Sec - Displays the error rate that occurred during a polling cycle. Applicable
only for error measures.
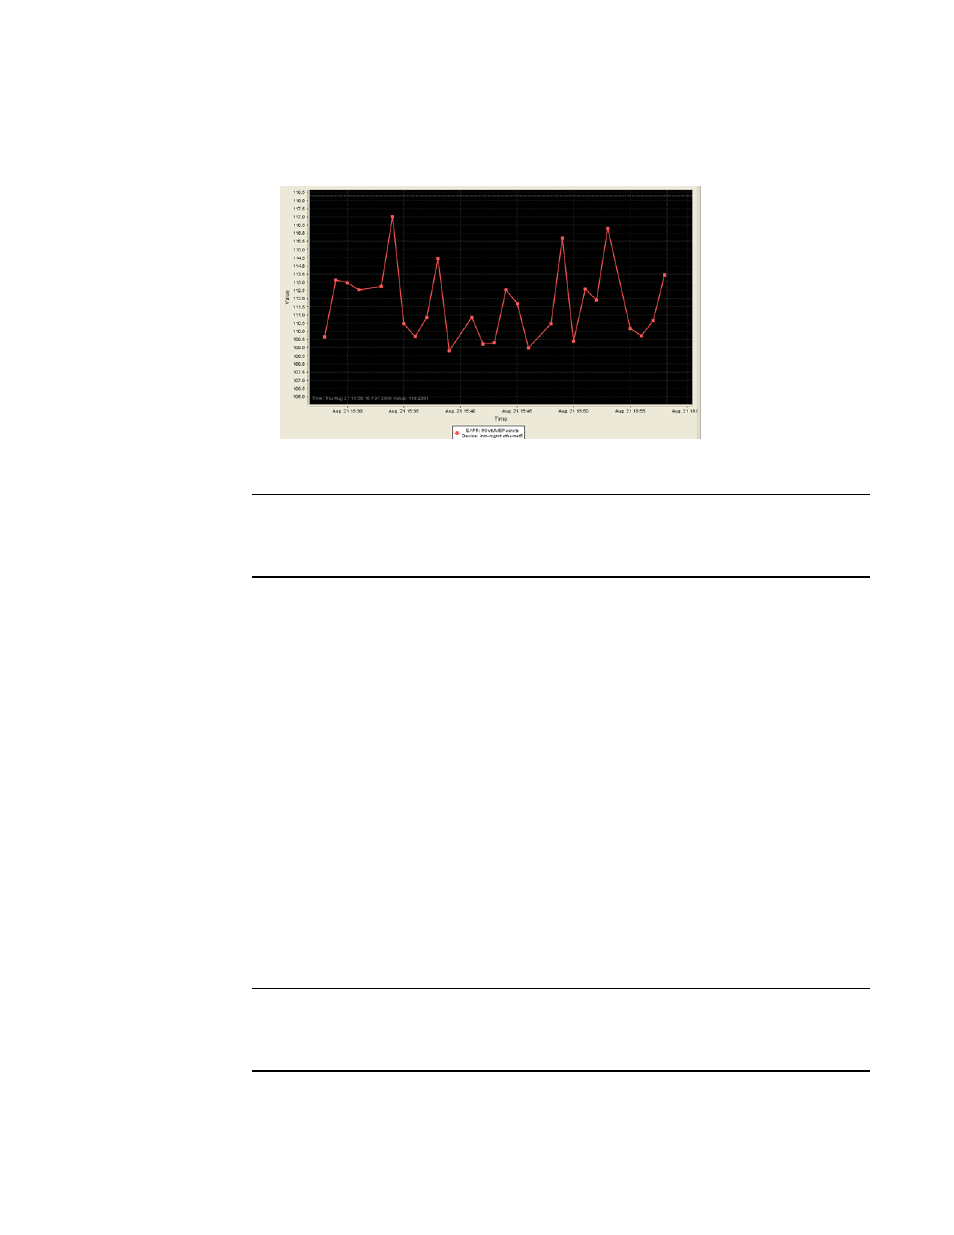
FIGURE 466
Show data points graph
NOTE
Although these settings will apply to all performance graphics in the Management application,
the change will not reflect instantly on the performance monitor that displays the graph.
Rather, the change will be updated the next time those monitors are launched.
3. Click Options to launch the Graph Options dialog box. Refer to
page 1122 for instructions on using this dialog box.
4. Select the Graph or Table option to display data in graphical or tabular format.
5. Select a time range relative to the present for the display of historical data from the For list.
The options are incremental from the last 30 minutes to the last 24 hours.
6. (Historical graphs and monitors only) Select the Plot Min/Max check box to plot minimum and
maximum values along with the average data point.
The range between the minimum and maximum values will be represented in a color band
surrounding the data points. The width of the color band indicates the variation during the time
period. Note that this option is not available if you select Minimum Interval granularity.
7. (Historical graphs and monitors only) Select one of the following options from the Granularity
list to set the granularity of the data point to display on the graph:
•
5 minutes
•
30 minutes
•
2 hours
•
1 day
NOTE
The graph will not update dynamically if the granularity is 30 minutes, 2 hours, or 1 day. To
update, move from one granularity setting to another. The graph will update dynamically when
Minimum Interval is selected.
8. Select the Events check box to display advanced monitoring service (AMS) violation events
received during the chart time range.