Viewing poe charts – Brocade Network Advisor IP User Manual v12.3.0 User Manual
Page 1253
Brocade Network Advisor IP User Manual
1201
53-1003153-01
Data monitoring
36
•
Med Serial number — The serial number on the connected device.
•
Med Manufacturer — The manufacturer name on the connected device.
•
Med Model name — The model name on the connected device.
5. Click OK to close the Properties dialog box.
6. Click Close to close the Power Center dialog box.
Viewing PoE charts
To view a PoE chart, complete the following steps.
1. Select Monitor > Power Center.
The Power Center dialog box displays.
2. Select Charts from the View list.
3. Review the Chart data:
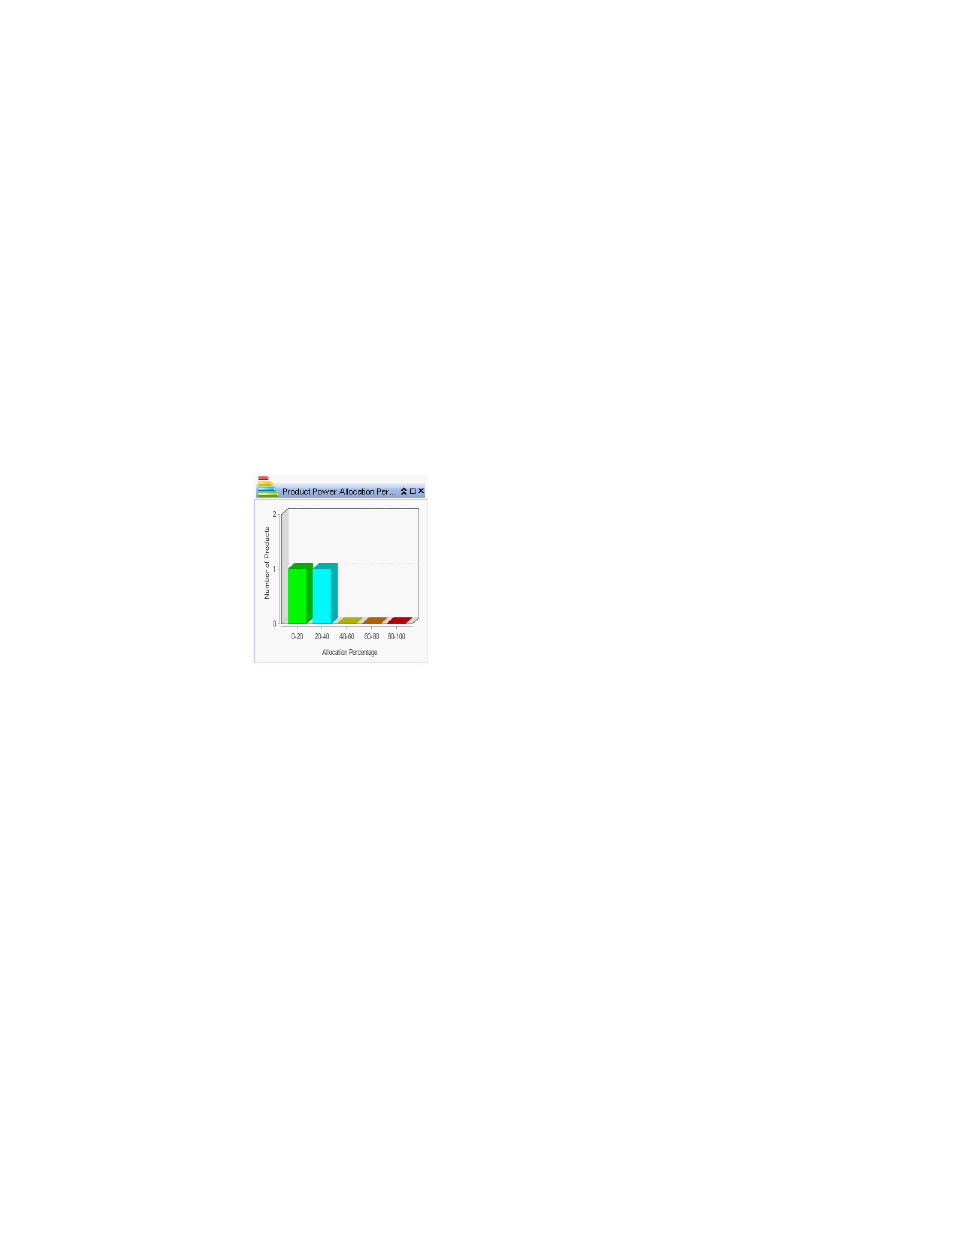
FIGURE 512
Product Power Allocation Percentage bar graph
Displays the power allocation percentages for all products in a bar graph using the following
colors:
•
0 – 20 % = Green
•
20 – 40 % = Blue
•
40 – 60 % = Yellow
•
60 – 80 % = Orange
•
80 – 100 % = Red