Y2 axis – Metrohm tiamo 1.1 Manual User Manual
Page 303
Subwindow Curves
275
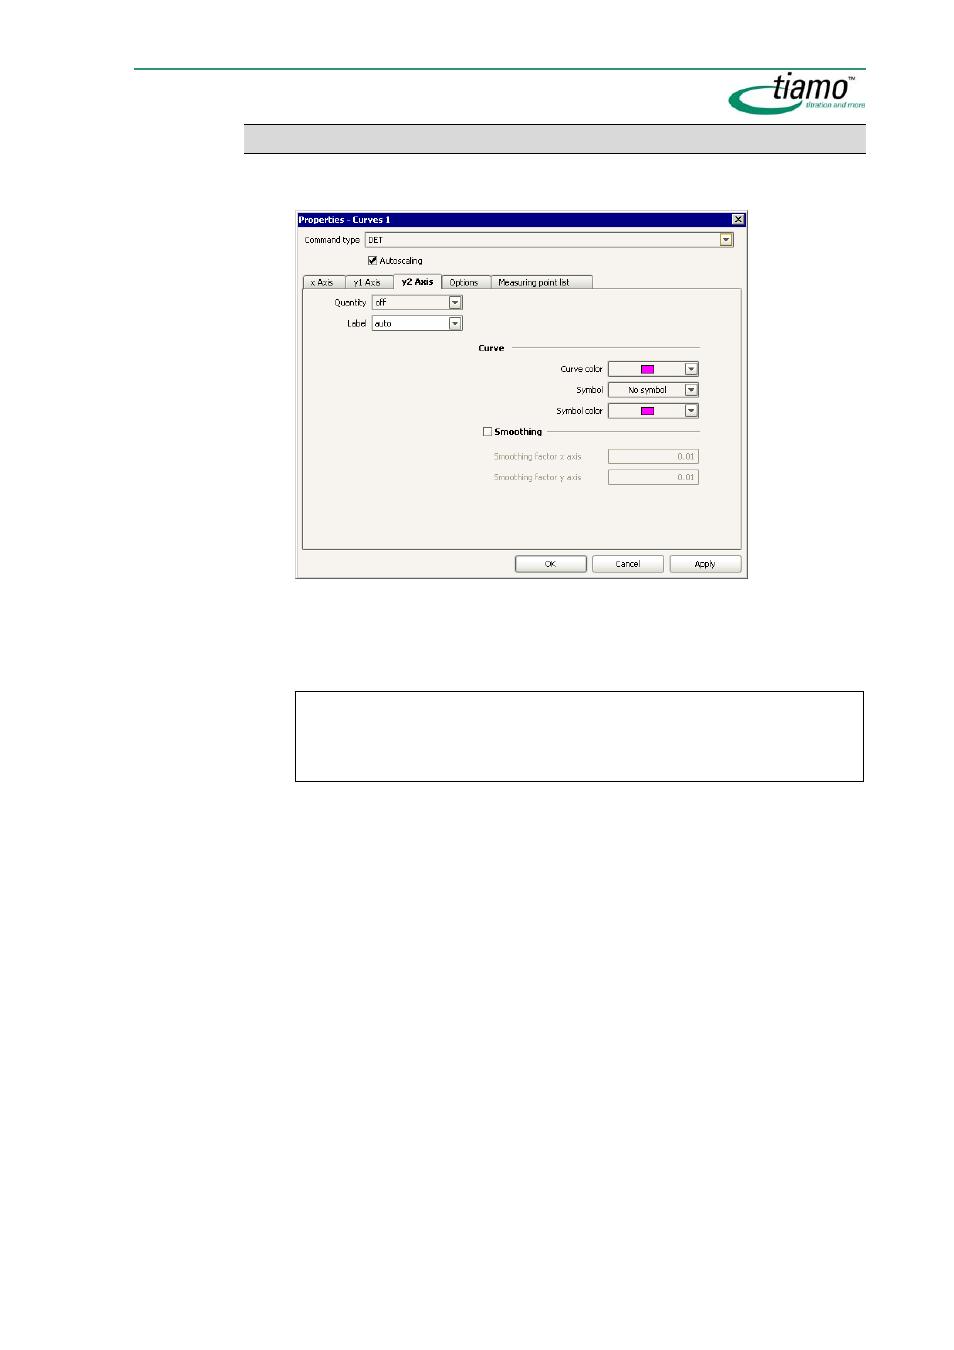
y2 Axis
Parameters for the graphical presentation of the curves on the y2 axis (right-hand
y axis).
Command type
[ DET ], MET, SET, KFT, KFC, STAT, MEAS, MEAS T/Flow, DOS
Selection of the command type for which the curve properties are to be de-
fined. The curve properties defined per command type are saved per curve
window and per client.
Note
When the dialog window is opened the particular
Command type
that will be se-
lected as standard is that which applies for the curve shown in the curve win-
dow.
Autoscaling
[ on ], off
If this option is switched on then all axes in the curve window will be scaled
automatically.
Quantity
Command-dependent selection
Selection of the quantity to be shown on the y2 axis.
Label
50 characters, [ auto ]
Freely definable axis labeling for the y2 axis. With
auto
the label from the
field
Quantity
will be used.
Curve
Curve color
Color selection, [ pink ]
Selection of the color for the curve line.
Symbol
Symbol selection, [ off ]
Selection of the symbol for showing the measured values. With
off
the
measuring points will not be shown.
Symbol color
Color selection, [ pink ]
Selection of the color for the measuring point symbol.