Y-axis – Metrohm tiamo 1.1 Manual User Manual
Page 240
212
Database
Scaling
Start value
1 E-8 ... [ 0.0 ] ... 1 E+8
Initial value for scaling the x-axis.
End value
1 E-8 ... [ 1000.0 ] ... 1 E+8
Final value for scaling the x-axis.
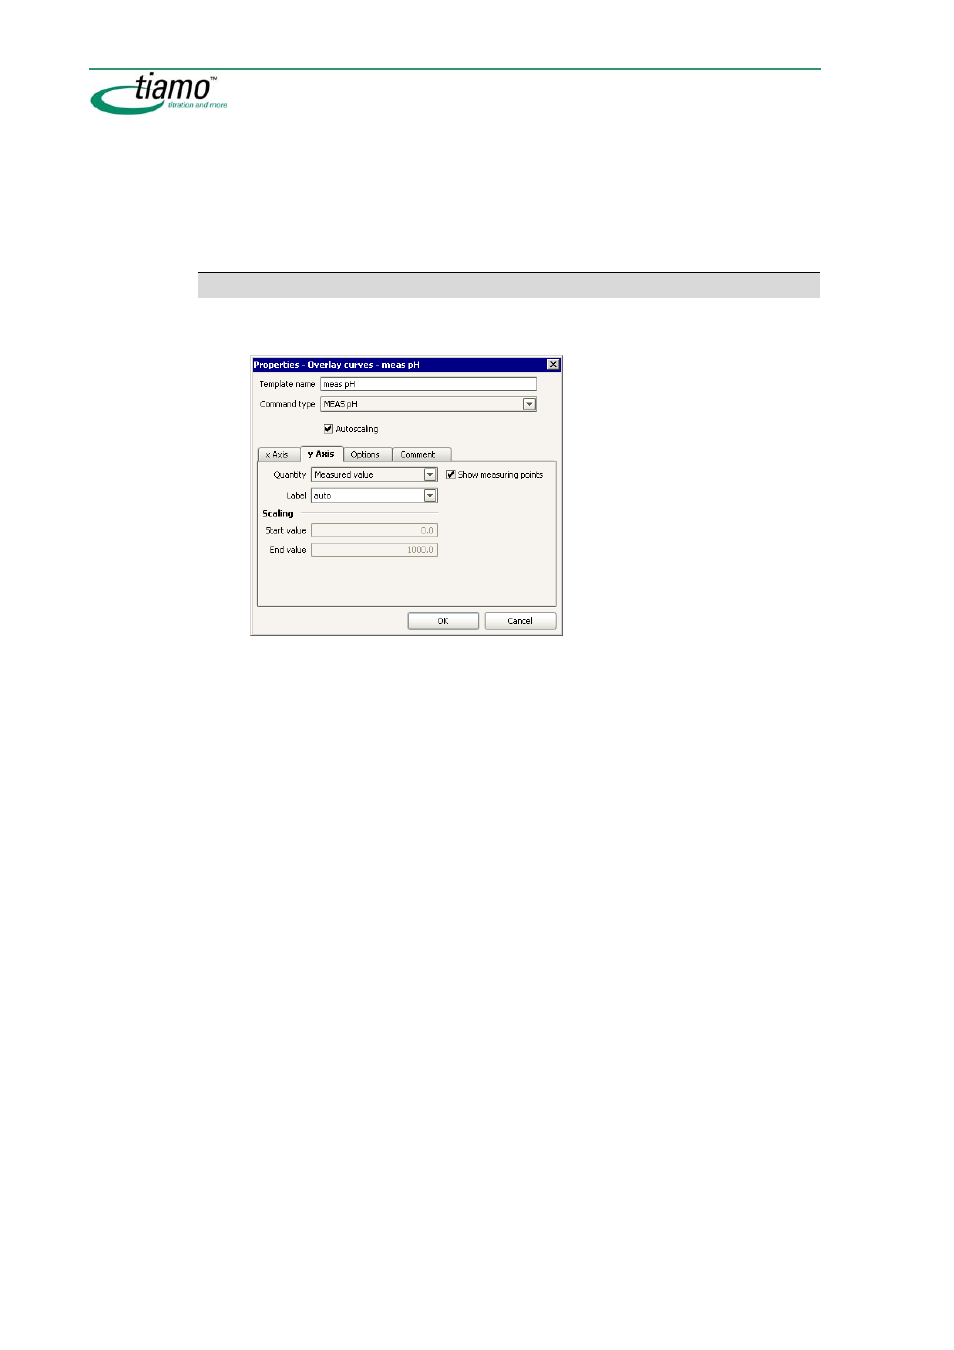
y-axis
Parameters for the graphical presentation of the superimposed curves on the y
axis.
Template name
50 characters
Name for the curve overlay template which is saved in the configuration da-
tabase per client.
Command type
Selection of command types
Selection of the command type from which curves are to be superimposed.
Autoscaling
[ on ], off
If this option is switched on then the x axis in the curve window will be
scaled automatically. In this case the fields
Start value
and
End value
cannot
be edited.
y Axis
Quantity
Command-dependent selection
Selects the quantity to be shown on the y axis.
Label
25 characters, [ auto ]
Freely definable axis labeling for the y axis. With
auto
the label from the field
Quantity
will be used.
Show measuring points
[ on ], off
If this option is switched on then the individual measuring points will be
shown on the curve.
Scaling
Start value
1 E-8 ... [ 0.0 ] ... 1 E+8
Initial value for scaling the y-axis.
End value
1 E-8 ... [ 1000.0 ] ... 1 E+8
Final value for scaling the y-axis.