Y1-axis – Metrohm tiamo 1.1 Manual User Manual
Page 301
Subwindow Curves
273
Quantity
Command-dependent selection
Selection of the quantity to be shown on the x axis.
Label
50 characters, [ auto ]
Freely definable axis labeling for the x axis. With
auto
the label from the field
Quantity
will be used.
Scaling
Start value
1 E-8 ... [ 0.0 ] ... 1 E+8
Initial value for scaling the x axis.
End value
1 E-8 ... [ 1000.0 ] ... 1 E+8
Final value for scaling the x axis.
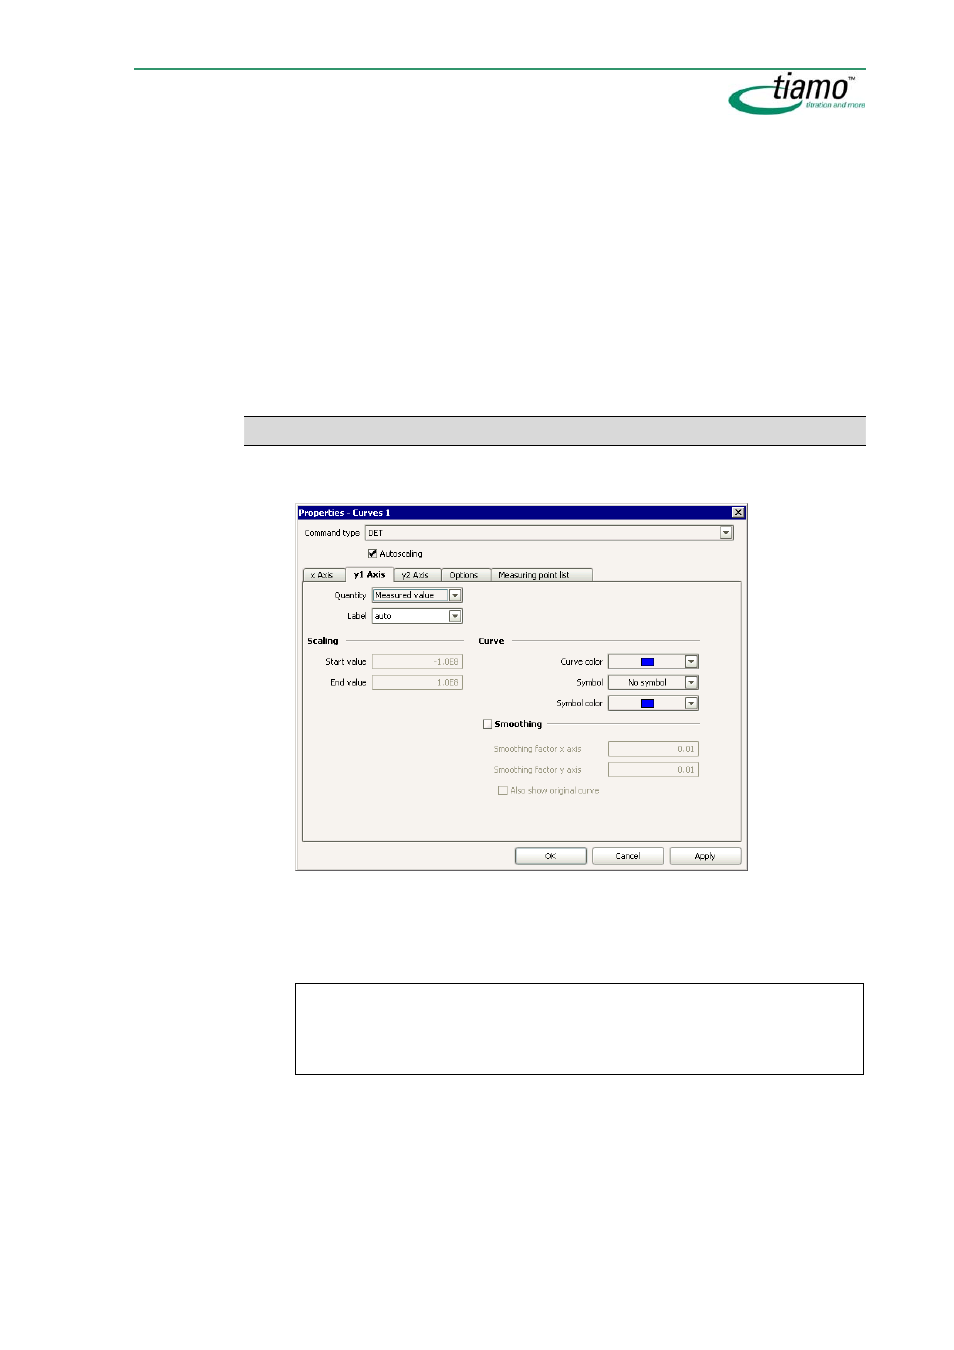
y1-axis
Parameters for the graphical presentation of the curves on the y1 axis (left-hand y
axis).
Command type
[ DET ], MET, SET, KFT, KFC, STAT, MEAS, MEAS T/Flow, DOS
Selects the command type for which the curve properties are to be defined.
The curve properties defined per command type are saved per curve win-
dow and per client.
Note
When the dialog window is opened the particular
Command type
that will be se-
lected as standard is that which applies for the curve shown in the curve win-
dow.
Autoscaling
[ on ], off
If this option is switched on then all axes in the curve window will be scaled
automatically. In this case the fields
Start value
and
End value
cannot be ed-
ited.
Quantity
Command-dependent selection
Selection of the quantity to be shown on the y1 axis.