Bus utilization buttons, 15 data report – Teledyne LeCroy Sierra M6-4 SAS_SATA Protocol Analyzer User Manual User Manual
Page 254
Teledyne LeCroy
Analysis
250
Sierra M6‐4 SAS/SATA Protocol Analyzer User Manual
Hovering the mouse over the graph heading displays the graph legend:
Go to ATA/SCSI Cmd. #: Jump to command.
Synchronize with Trace View: Synchronize all open views to that location in the
trace.
Fit to Graph Area: Zoom to fit.
Hide: Do not display the graph.
To synchronize all open views to that location in the trace, double‐click the graph.
Bus Utilization Buttons
The Bus Utilization window has a row of buttons for changing the format of the displayed
data. The buttons have the following functions:
3.3.15
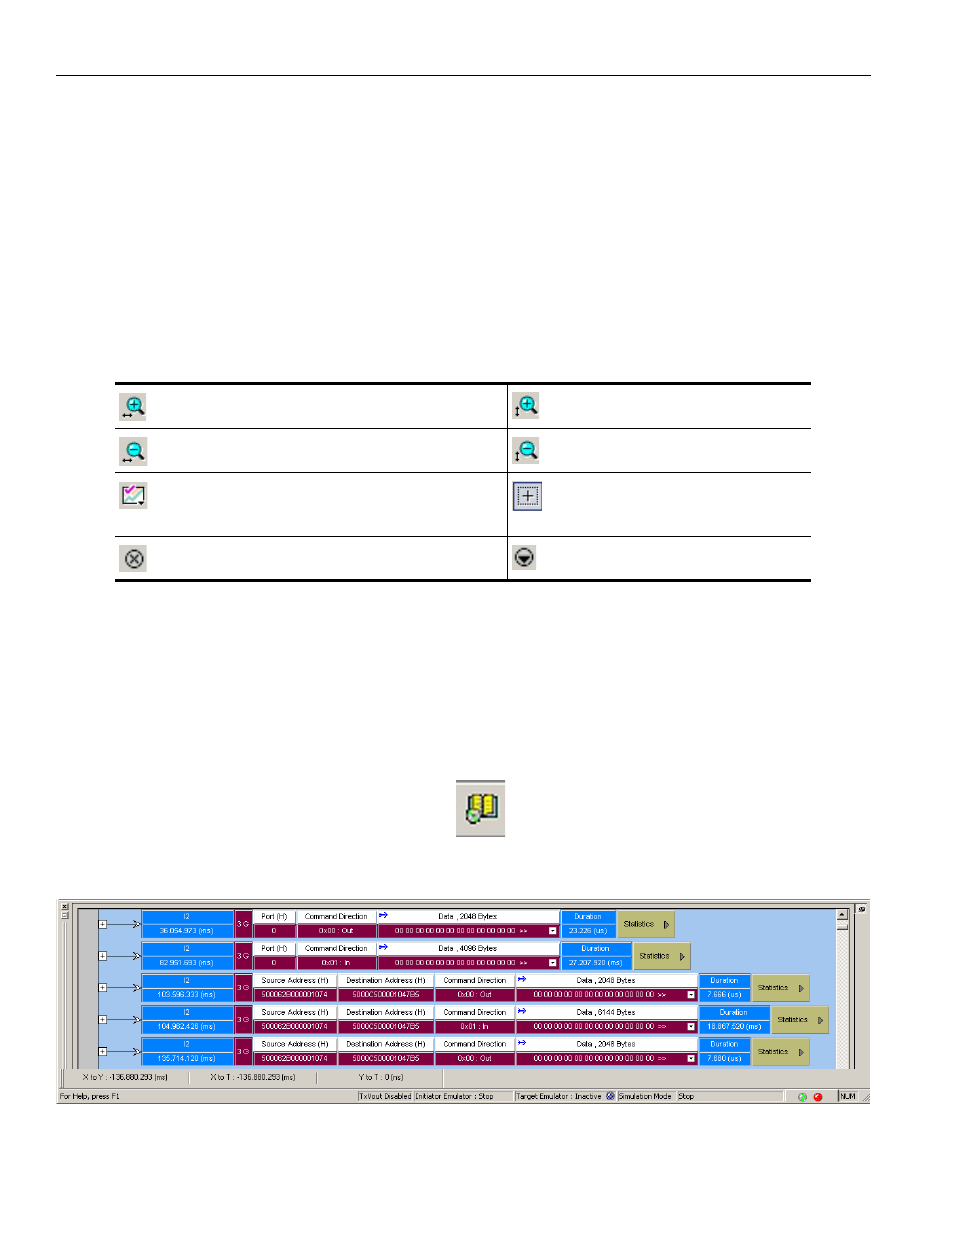
Data Report
When a captured trace is in the Trace Viewer, the Data Report button is active on the
Viewer toolbar, and Data Report is active in the Report menu.
The data report displays all the data sent from the host to the device and from the device
to the host. All PIO In =>In commands are grouped as a data packet until the occurrence
of a PIO Out =>Out command, creating a new data packet.
To display a Data Report, click the
Data Report button on the Viewer toolbar or
select Report > Data Report.
Figure 3.67: SAS: Data Report
Horizontal zoom in
Vertical zoom in
Horizontal zoom out
Vertical zoom out
Graph Areas
Presents options for displaying additional
graphs.
Click and Drag zoom
Click diagonally to select and
zoom in on part of the graph.
Hide graph.
Graph legend (see previous
page)