Making a timing measurement, Expanded waveform view, 10 statistical report – Teledyne LeCroy Sierra M6-4 SAS_SATA Protocol Analyzer User Manual User Manual
Page 230
Teledyne LeCroy
Analysis
226
Sierra M6‐4 SAS/SATA Protocol Analyzer User Manual
Making a Timing Measurement
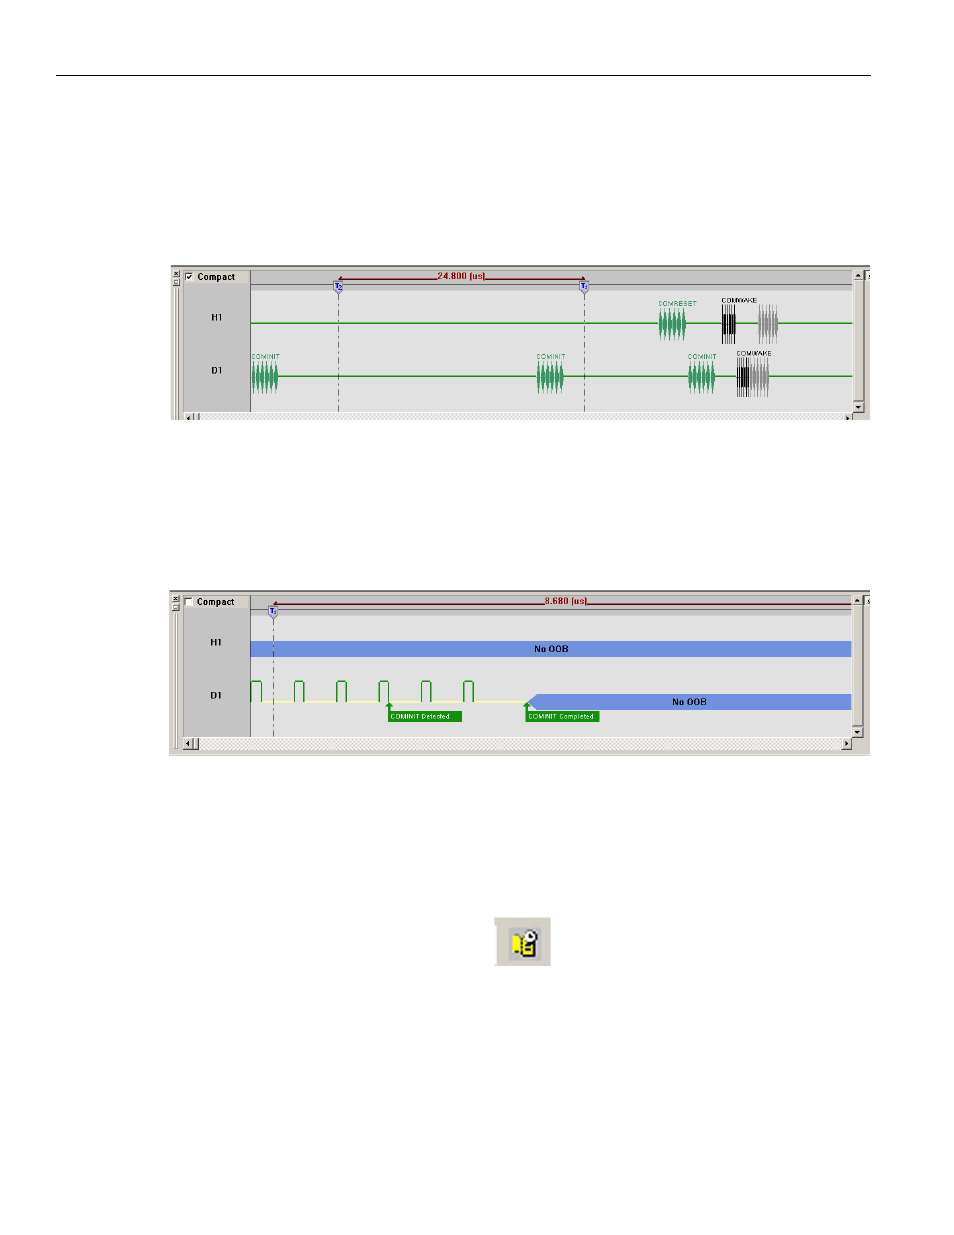
Timing measurements are made with two timing cursors T1 and T2. Click the left mouse
button in the gray bar on the top of the waveform display at a point for the T1 cursor, and
the right mouse button at a point for the T2 cursor. The time difference between the
cursors is on a line connecting the two cursors (see
Figure 3.22: SATA: Timing Cursors Enabled
Expanded Waveform View
To see a 10x time scale expansion of the waveform, uncheck the Compact View checkbox in
the Waveform View window. The OOB Sequence has speed negotiation (Hardware version 4
or later) (see
).
Figure 3.23: SATA: Expanded Waveform View
3.3.10
Statistical Report
Whenever a captured sample is in the Sample Viewer, a Statistical Report selection in the
Report menu and a Statistical Report Button on the viewer toolbar are enabled. You can
create a Statistical Report for the entire capture or select a portion of it.
To display a Statistical Report, click the
Statistical Report button on the viewer
toolbar or select Report > Statistical Report to display the Select Statistical Report Range
dialog (see
).