10 subwindow results, 1 overview, 2 results overview – Metrohm tiamo 1.0 Manual User Manual
Page 282
258
Database
4.10 Subwindow
Results
4.10.1 Overview
General
In the subwindow
Results
the results calculated in the calculation commands and
the variables used for their calculation are shown for the determination focused in
the Determination table. The subwindow can be switched on in the program part
Database
in the definition of the Layout and thus made visible. It can be enlarged
and diminished as required; it can also be maximized.
Tabs
The results of the determination are shown on the following tabs:
•
Results overview
Shows the results overview for all calculation commands.
•
'Command name'
Shows the results for a single calculation command. A tab with the
corresponding command name is provided for each calculation com-
mand.
•
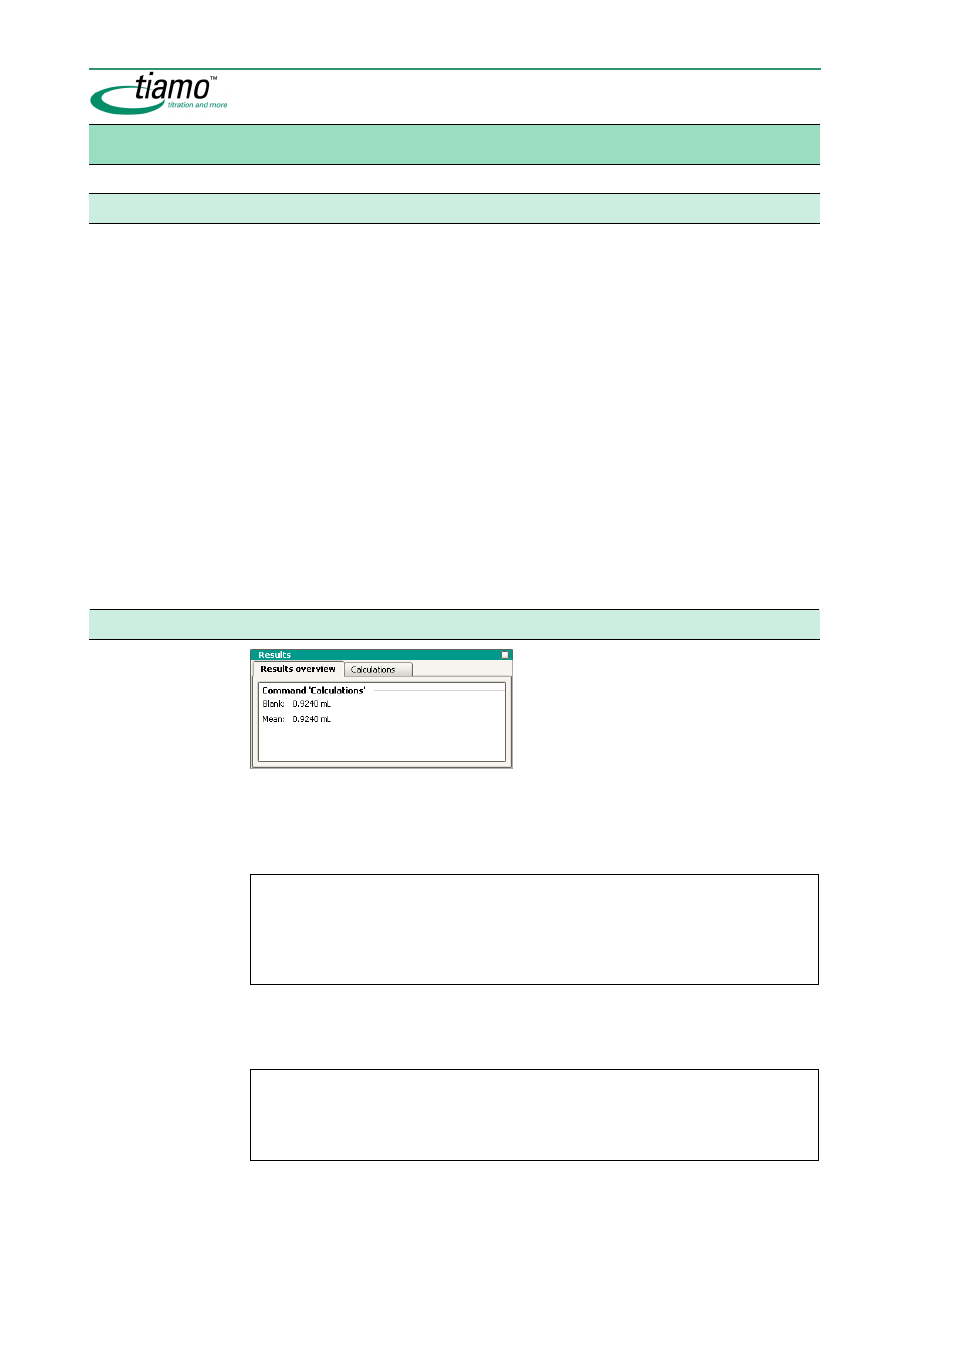
4.10.2 Results
overview
Shows the results overview for all calculation commands.
Command 'Command name'
Name of the
CALC
command for which the results are shown.
Note
Only the last results to have been calculated will be shown. For example, if there
are several commands that produce a result with the same name, then the cor-
responding result data will only be shown for that command that was the last to
calculate the result. Nothing will be shown for the other commands.
'Result':
Shows the result name and result value with the defined number of decimal
places and units.
Note
If a result value is monitored and if it lies within the limits defined in the
CALC
command then the text will be shown in
green; if it is outside the limits it will be
shown in
red.
Mean value:
Shows the mean value for statistically evaluated results.