Metrohm tiamo 1.0 Manual User Manual
Page 268
244
Database
In the dialog window
End points
the end points of the selected curve are shown in
tabular form. If an end point is added to or deleted from the curve then the table
will be updated automatically.
End point
Name of the end point with number. The following names are possible:
EP#
End point that has been determined automatically by potentiometric evalua-
tion or set manually by using the intersection or tangent method.
BP#
End point that has been determined by automatic break point evaluation.
FP#
End point that has been determined by automatic fixed point evaluation.
X (mL)
Volume value in mL for end point.
Y (pH)
Measured value (pH) for end point.
Deletes the selected end point from the table.
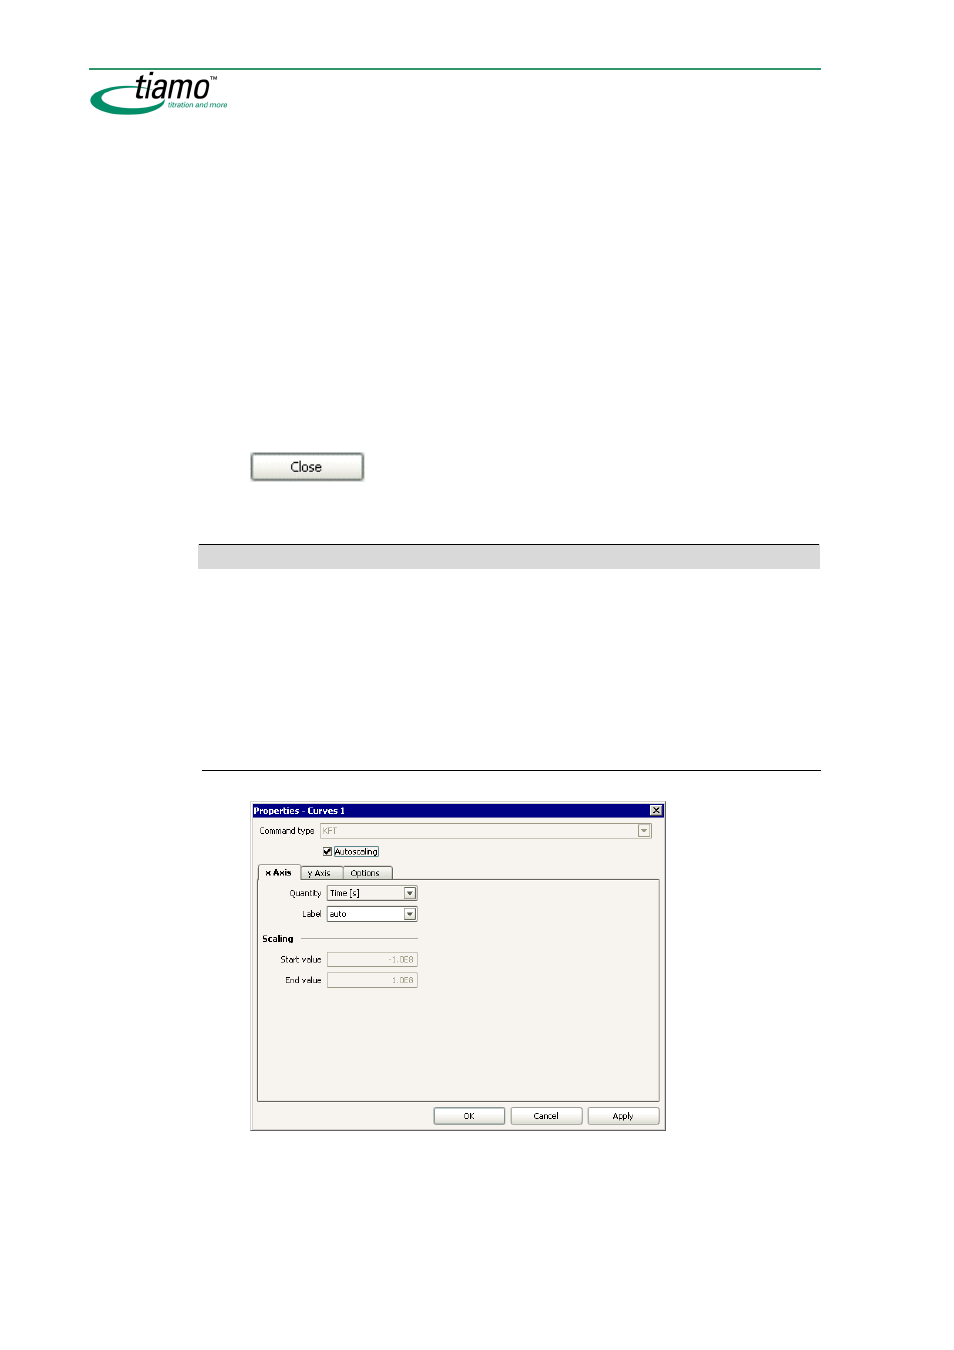
Properties
The properties of the curve display in the curve evaluation window can be set on
the following 3 tabs:
•
x Axis
Parameters for the graphical display of the curve on the x axis.
•
y Axis
Parameters for the graphical display of the curve on the y axis.
•
Options
Options for the graphical display of the curve.
x axis
Command type
[ DET ], MET, SET, KFT, KFC, MEAS, MEAS T/Flow
Shows the type of command for which the curve properties can be defined.
The curve properties defined by command type for the reprocessing win-
dow are saved per client.