Metrohm tiamo 1.0 Manual User Manual
Page 254
230
Database
Show calibration curve
With the menu item
Determinations, Show calibration curve...
or the symbol
cali-
bration curves and calibration data are shown for the calibration selected in the
dialog window
Calibration curve
.
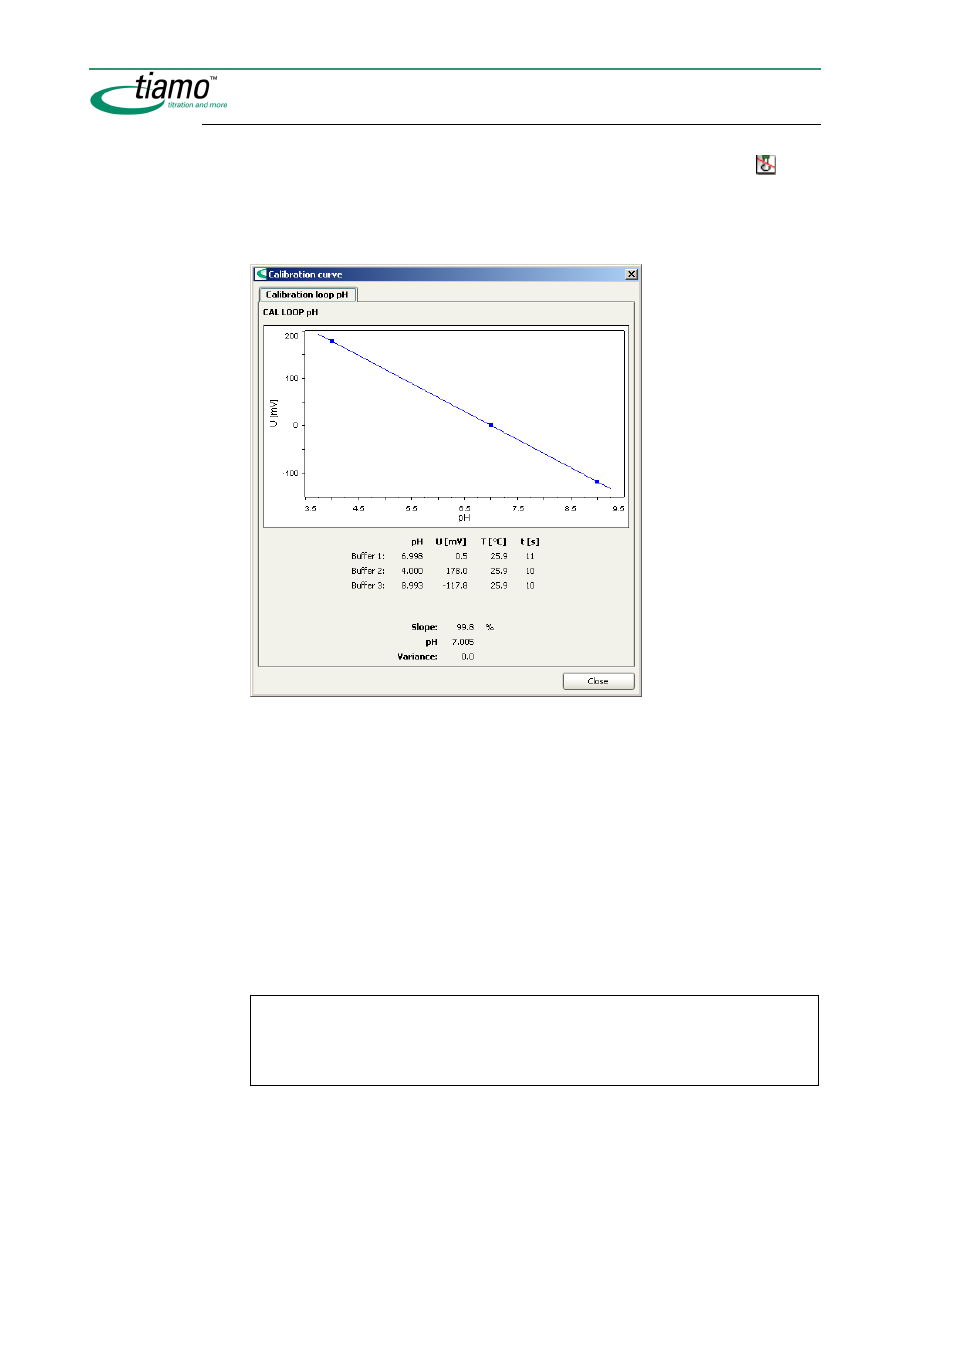
Calibration curve for CAL LOOP pH
In the dialog window
Calibration curve
a tab marked with the command name and
showing the calibration curve and calibration data will be shown for each
CAL
LOOP pH
command. The command type is shown above the calibration curve. The
curve display shows the measured values and the curve calculated from these
measured values. Below it are listed the individual measured values and the re-
sults for
Slope
,
E(0)
and
Variance
.
Calibration curve for CAL LOOP Conc
In the dialog window
Calibration curve
a tab marked with the command name and
showing the calibration curve and calibration data will be shown for each
CAL
LOOP Conc
command. The command type is shown above the calibration curve.
The curve display shows the measured values and the curve calculated from
these measured values. Below it are listed the individual measured values and the
results for
Slope
,
E(0)
,
c(blank)
and
Variance
.
Note
Calibration curves cannot be printed out directly from the dialog window
Calibra-
tion curve
. Instead you should use a report with a Report template in which the
fixed report
Calibration curve
is contained.