Metrohm tiamo 1.0 Manual User Manual
Page 226
202
Database
•
y Axis
Parameters for the graphical presentation of the superimposed curves
on the y axis.
•
Options
Options for the graphical presentation of the superimposed curves.
•
Comment
Entry of comments for the template.
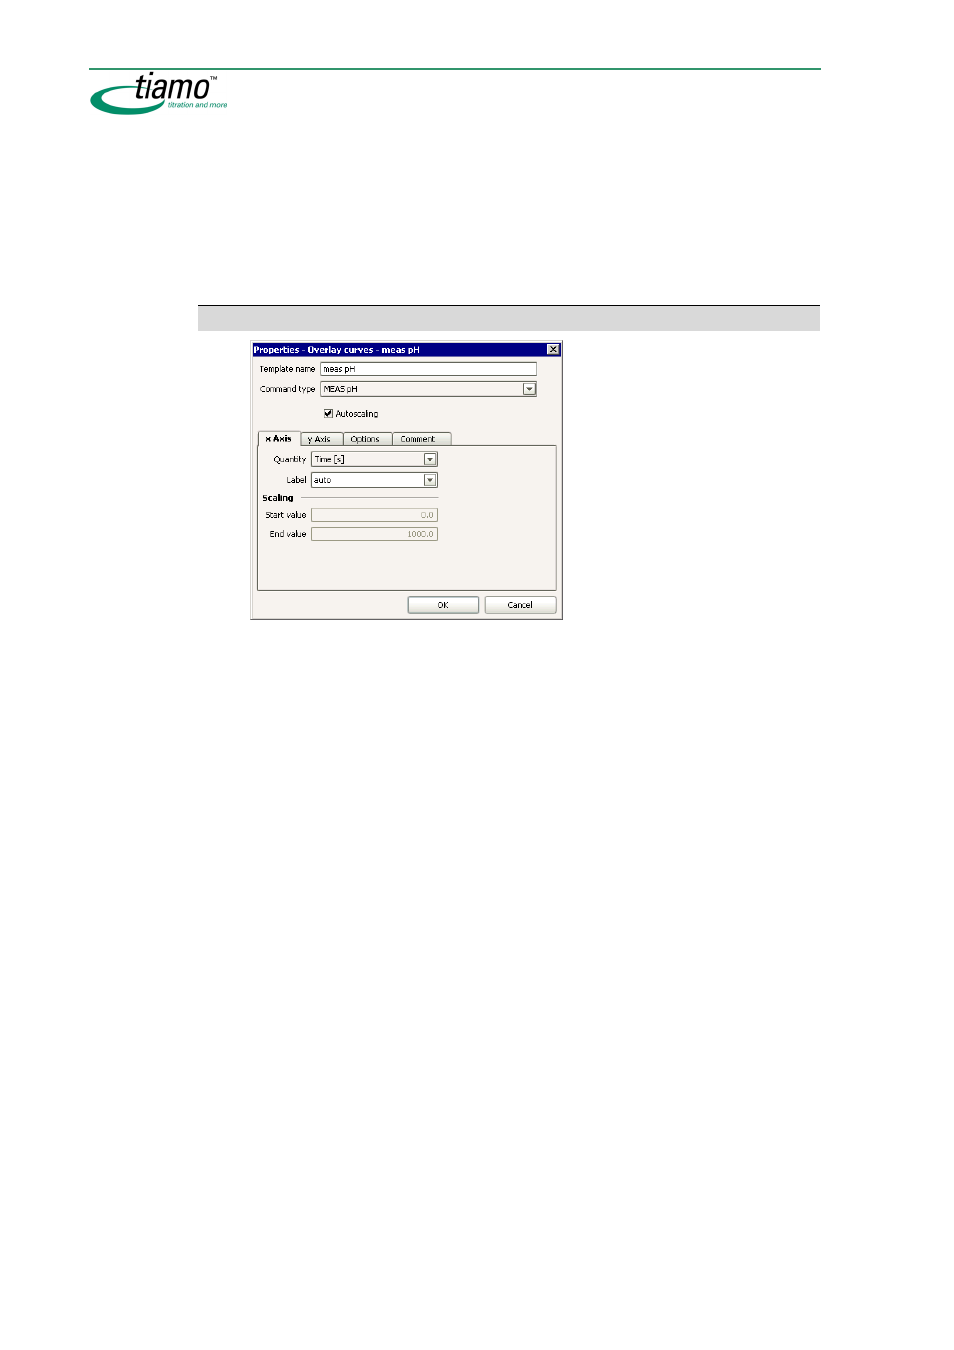
x Axis
Template name
50 characters
Name for the curve overlay template which is saved in the configuration da-
tabase per client.
Command type
Selection of command types
Selection of the command type from which curves are to be superimposed.
Autoscaling
[ on ], off
If this option is switched on then the x axis in the curve window will be
scaled automatically. In this case the fields
Start value
and
End value
cannot
be edited.
Parameters for the graphical presentation of the superimposed curves on the x
axis.
x Axis
Quantity
Command-dependent selection
Selects the quantity to be shown on the x axis.
Label
25 characters, [ auto ]
Freely definable axis labeling for the x axis. With
auto
the label from the field
Quantity
will be used.
Scaling
Start value
1 E-8 ... [ 0.0 ] ... 1 E+8
Initial value for scaling the x-axis.
End value
1 E-8 ... [ 1000.0 ] ... 1 E+8
Final value for scaling the x-axis.