Metrohm tiamo 1.0 Manual User Manual
Page 212
188
Database
Properties
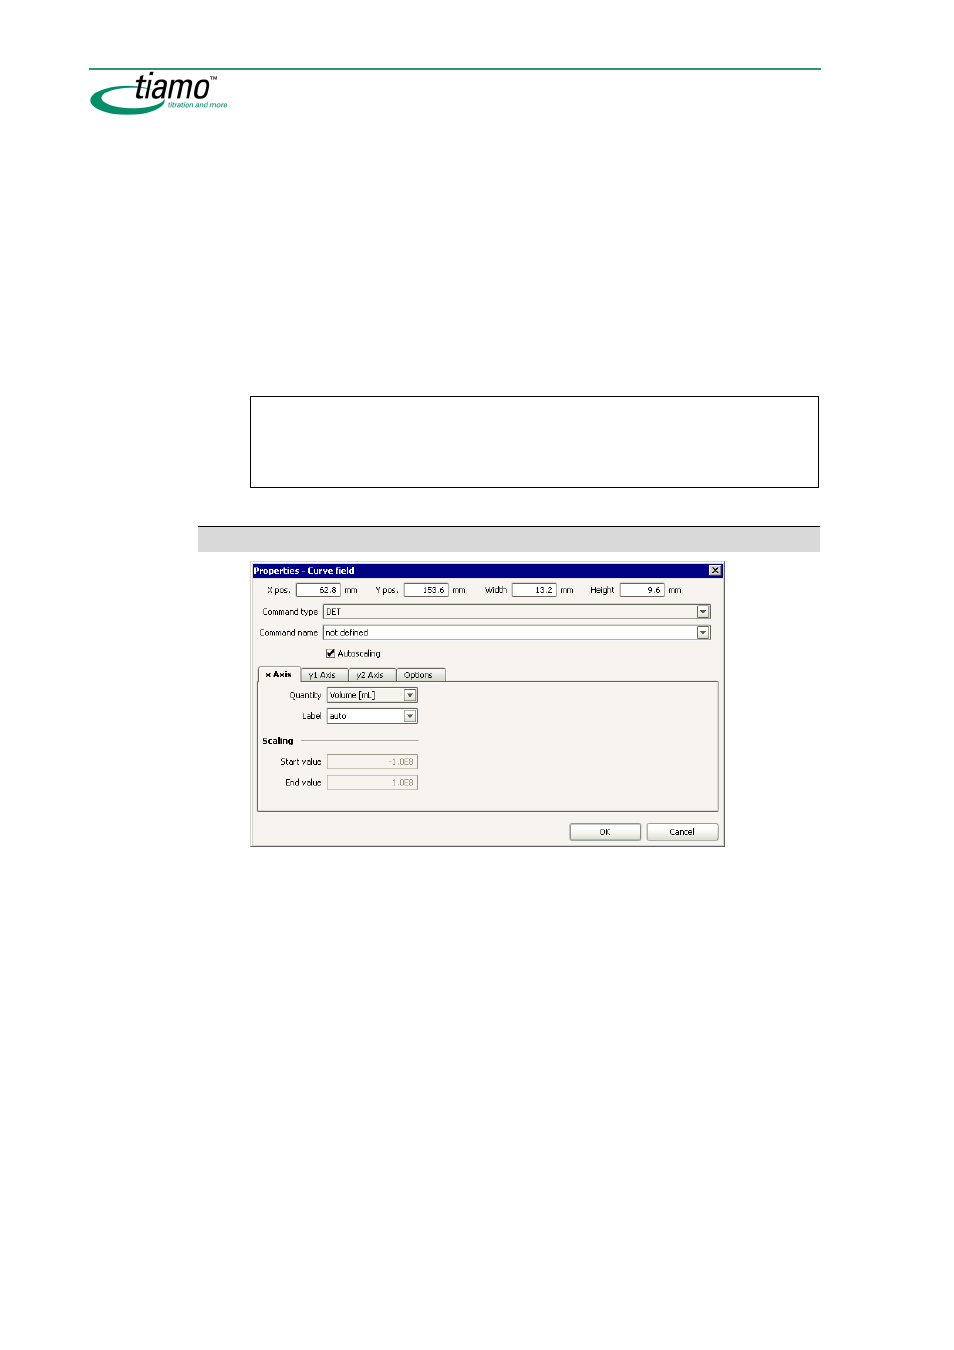
The properties for the curve field can be set on the following 4 tabs:
•
x Axis
Parameters for the graphical display of the curve on the x axis.
•
y1 Axis
Parameters for the graphical display of the curve on the y1 axis (left-
hand y axis).
•
y2 Axis
Parameters for the graphical display of the curve on the y2 axis (right-
hand y axis).
•
Options
Options for the graphical display of the curve.
Note
The properties are saved individually for each curve field. This means that it is
possible, e.g., to show several different curves for the same measuring com-
mand beside one another in several curve fields.
Curve field - x axis
X pos.
0.0000 ... (max. page width) mm
x-position within the permitted section.
Y pos.
0.0000 ... (max. page width) mm
y-position within the permitted section.
Width
0.0000 ... (max. page width) mm
Width of curve field.
Height
0.0000 ... (max. page height) mm
Height of curve field.
Command type
[ DET ], MET, SET, KFT, KFC, MEAS, MEAS T/Flow
Selection of the type of command for which a curve is to be shown.
Command name
[ not defined ], 50 characters
Name of the command for which a curve is to be shown. With
not defined
the first curve present in the determination with the selected
Command type
will be produced as default.