Top or bottom port performance monitors – Brocade Network Advisor SAN User Manual v12.1.0 User Manual
Page 275

Brocade Network Advisor SAN User Manual
225
53-1002948-01
User-defined performance monitors
7
•
Serial # — The serial number of the product.
•
Model — The product model.
•
Port Count — The number of ports on the product.
•
Firmware — The firmware level running on the product.
•
Location — The location of the product.
•
Contact — A contact name for the product.
•
Refreshed — The time of the last update for the monitor.
To configure a product performance monitor, refer to
“Configuring a user-defined product
Accessing additional data from top or bottom product monitors
In a Top N or Bottom N monitor, double-click a row or right-click a row and select Show Graph/Table
to navigate to the Historical Graphs/Tables dialog box for the selected measures. For more
information, refer to
Top or bottom port performance monitors
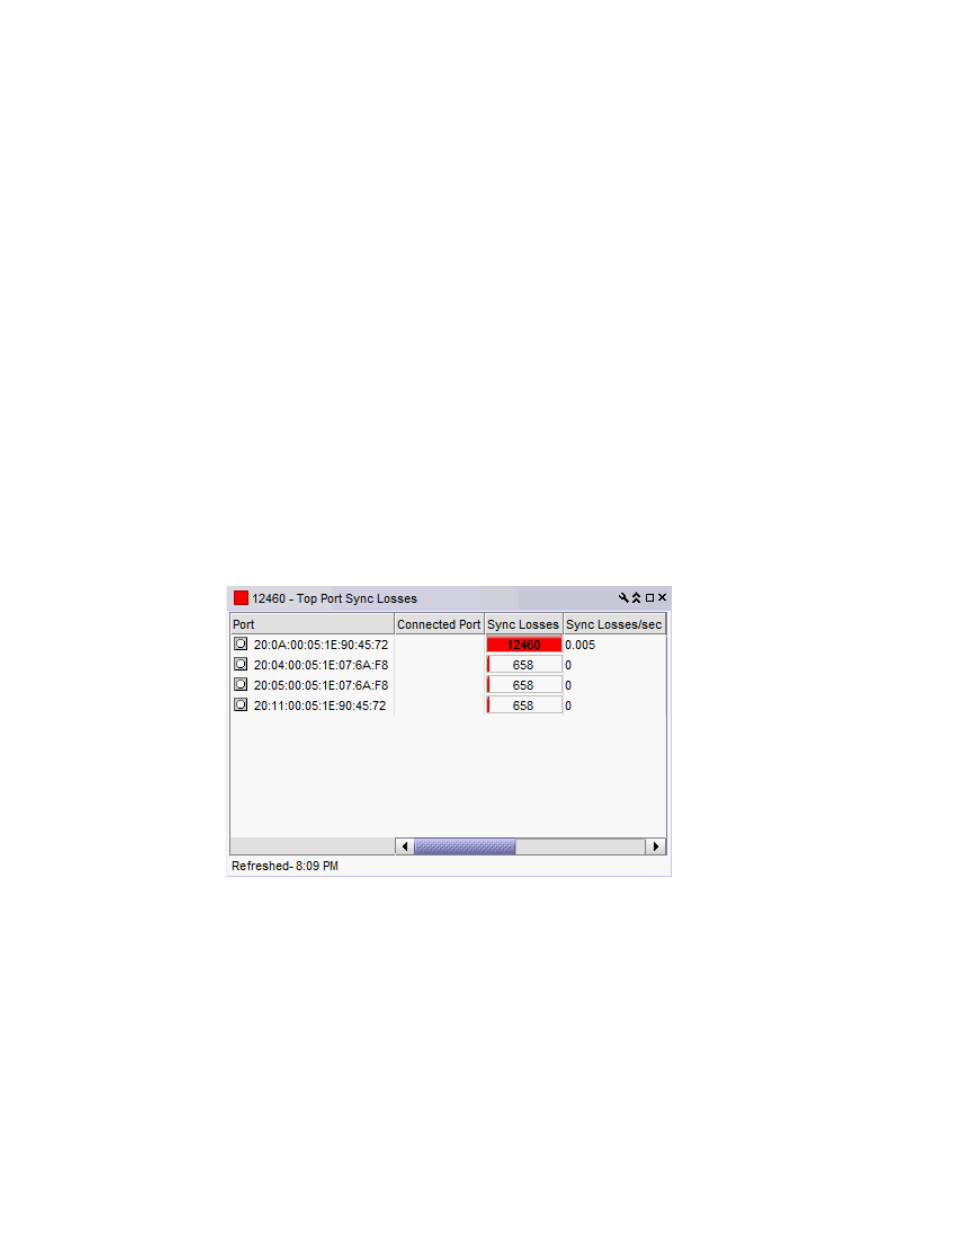
The top or bottom port performance monitors (
) display the top or bottom number of ports
(for example, bottom 10 ports) for the selected measure in a table.
FIGURE 83
Top or bottom port performance monitor example
The top or bottom port performance monitor includes the following data:
•
Threshold icon/object count/monitor title — The color associated with the threshold and
number of objects within that threshold displays next to the monitor title.
•
Severity icon/monitor title — The worst severity of the data based on the error count or error
rate shown next to the monitor title.
•
Port — The port affected by this monitor.
