Top or bottom product performance monitors – Brocade Network Advisor SAN User Manual v12.1.0 User Manual
Page 274
224
Brocade Network Advisor SAN User Manual
53-1002948-01
User-defined performance monitors
7
Generator Receive Frame Count (frames) — The received frame count as reported in
the last data point received for the flow.
Mirrored Frames Count (frames) — The mirrored frame count as reported in the last
data point received for the flow.
Mirrored Tx Frames (frames) —The mirrored transmit frame count as reported in the
last data point received for the flow.
Mirrored Rx Frames (frames) —The mirrored received frame count as reported in the
last data point received for the flow.
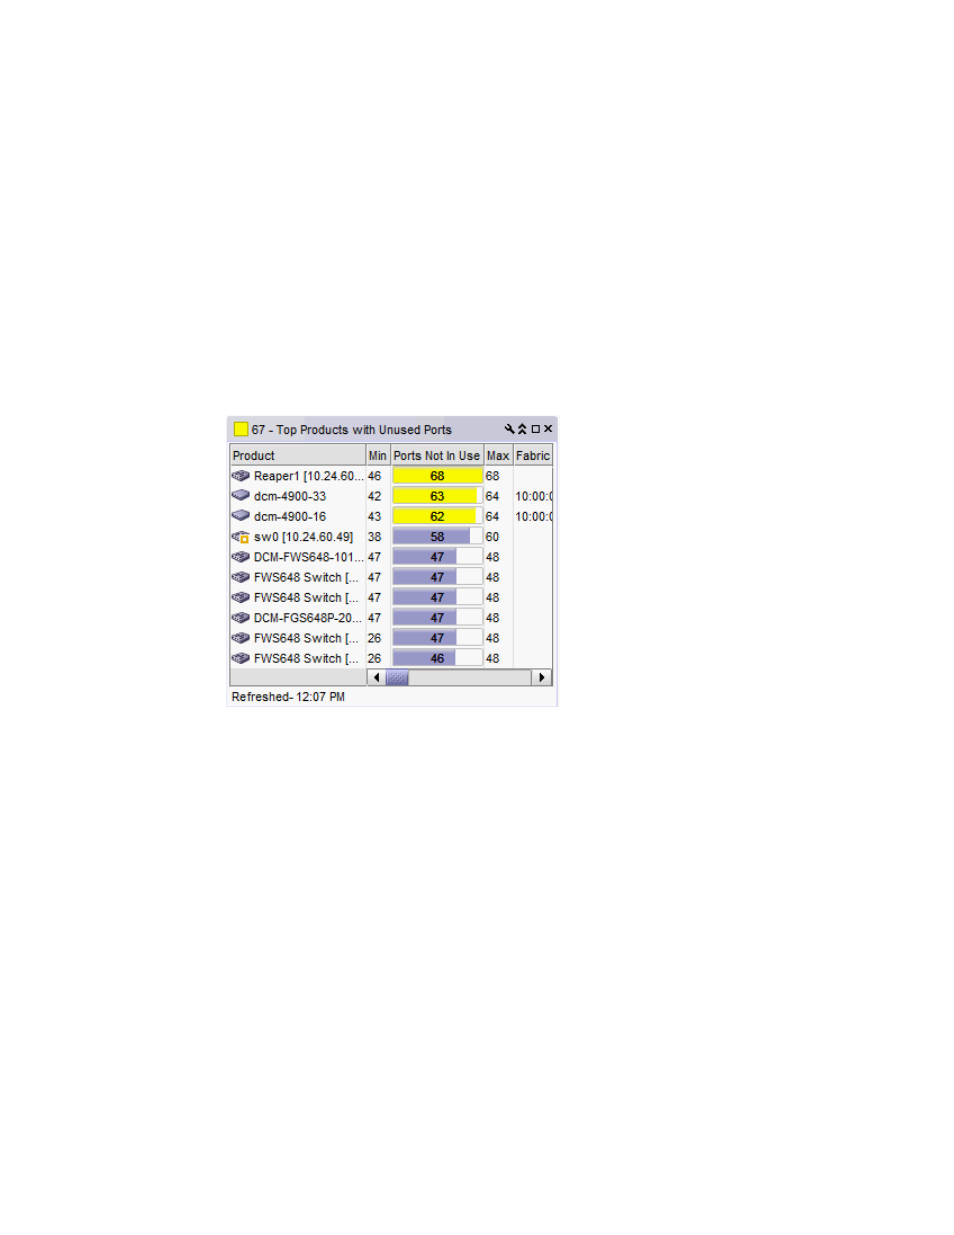
Top or bottom product performance monitors
The top or bottom product performance monitors (
) display the top or bottom number of
products (for example, top 10 products) for the selected measure in a table.
FIGURE 82
Top or bottom product performance monitor example
The top or bottom product performance monitor includes the following data:
•
Threshold icon/object count/monitor title — The color associated with the threshold and
number of objects within that threshold displays next to the monitor title.
•
Product — The product affected by this monitor.
•
Min — The minimum value of the measure in the specified time range.
•
Measure_Type — The percentage bar of the selected measure.
By default, products display sorted by the Measure_Type value (Top products sort from highest
to lowest and bottom products sort lowest to highest). Click a column head to sort the columns
by that value.
•
Max — The maximum value of the measure in the specified time range.
•
Fabric — The fabric to which the device belongs.
•
Product Type — The type of product (for example, switch).
•
State — The product state (for example, Offline).
•
Status — The product status (for example, Reachable).
•
Tag — The product tag.