Figure 16 – H3C Technologies H3C Intelligent Management Center User Manual
Page 65

51
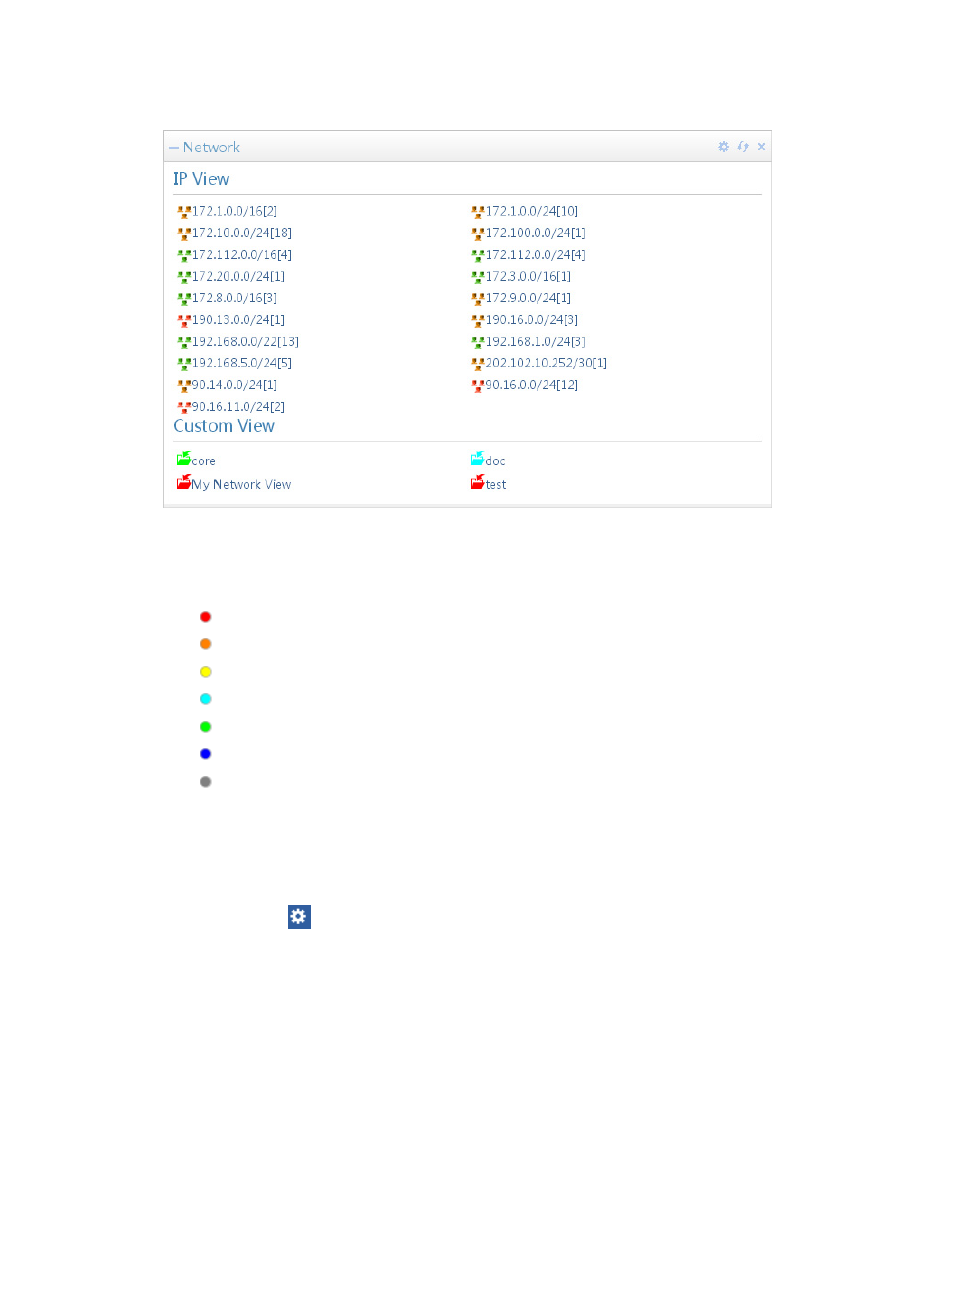
Figure 16 Network
The color of the icon for each IP segment or custom view reflects in real time the most severe alarm or
severity level of any device within the IP segment or custom view. Color-coding of the severity or alarm
level conforms to industry standards and is displayed in the list below:
•
Critical
•
Major
•
Minor
•
Warning
•
Normal
•
Informational
•
Unmanaged
These IP views provide drilldown to lists of all devices with their IP segments. To access these views, click
the link of the IP segment.
These custom views provide drilldown to lists of all devices with their respective groups. To access these
views, click the name of the custom view.
Click the Set icon
on the top right corner of the widget and select the Setting option to launch the
Setting dialog box.
•
Columns—Specifies the quantities of IP segments and custom views to be displayed per row for the
widget. The available options include 2, 4, 6, 8, and 10.
•
Network—Specifies the content to be displayed for the widget. Select Both to display both IP view
and custom view; select IP View to display only IP view; select Custom View to display only custom
view.
By default, Network widget is displayed on the Welcome space of the IMC home page.
For more information about the IP view and custom view, see "
