Realtime performance monitoring widget – H3C Technologies H3C Intelligent Management Center User Manual
Page 112
98
6.
Select an IP topology from the IP Topology/Subnet list.
7.
Click OK.
8.
Click Save Configuration .
Realtime Performance Monitoring widget
Figure 53 Widget icon
The Realtime Performance Monitoring widget displays real-time instance data that is directly read from
devices. Operators must select the instances for performance monitoring.
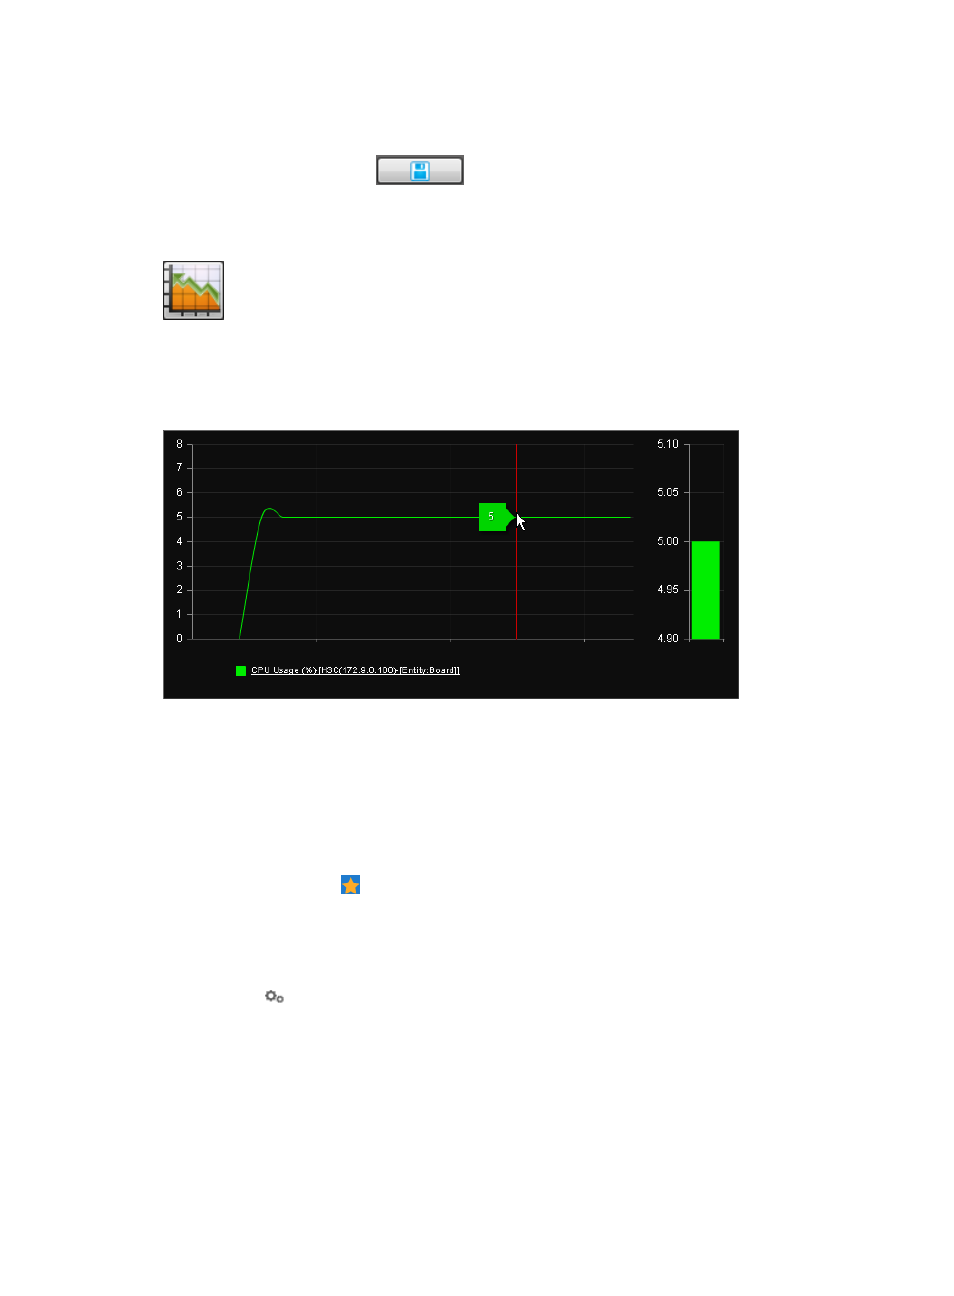
Figure 54 Realtime Performance Monitoring widget contents
When you place the pointer over a curve in the diagram, the performance data of the instance that the
curve represents automatically appears in a message balloon. To hide the message balloon, click the
instance name. When the instance name is no longer underlined, the message balloon does not appear
for the instance.
To configure the Realtime Performance Monitoring widget:
1.
Navigate to the view configuration window:
a.
Point to the icon located at the top of the left navigation tree.
A list of predefined and user-defined favorites appears.
b.
Point to the Display Tiling folder option.
The popup list appears.
c.
Click
Configuration in the popup list.
The view configuration window appears.
2.
Drag the Realtime Performance Monitoring widget from the widget area to the panel.
3.
Right-click the Realtime Performance Monitoring widget, and then select Parameter Configuration
from the shortcut menu.
The Parameter Configuration window appears.
4.
Select one or more monitor instances:
a.
Click the Add button in the Select Index area.