Yokogawa DAQWORX User Manual
Page 87
4-25
IM WX104-01E
D
splay
ng Data w
th the Data V
ewer
1
2
3
4
5
6
7
8
9
Index
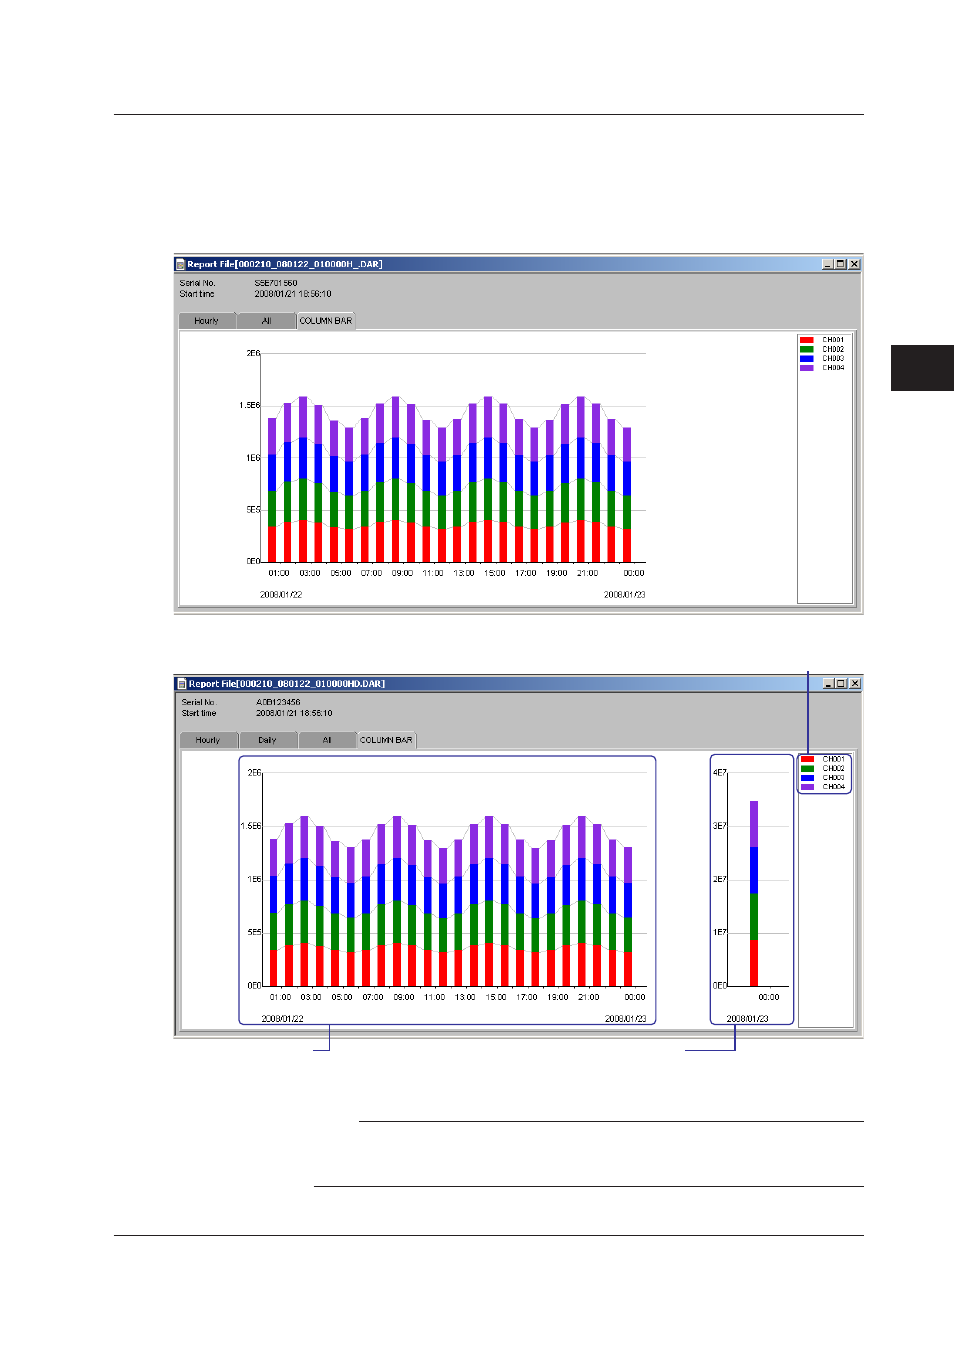
Dsplayng a Stacked Bar Graph of Report Data
You can display report data generated by the DX1000, DX1000N, DX2000, MV1000, or
MV2000 on a stacked bar graph.
If the report data type is hourly
The example below shows a stacked bar graph of hourly reports for channels 001 to 004.
If the report data type is hourly + daily
Daily
Displays weekly for daily + weekly
Displays monthly for hourly + monthly
Hourly
Displays hourly for hourly + weekly
Displays hourly for hourly + monthly
Channel display colors
Note
• The channel colors are fixed. You cannot change them.
• All channels in the report file are displayed on one screen.
• Channels containing errors, overflow, or negative values are not displayed.
4.9 Dsplayng the Report Fle