Displaying cursor’s values, Displaying statistics, Adding arbitrary marks – Yokogawa DAQWORX User Manual
Page 71: Displaying cursor’s values -9, Displaying statistics -9, Adding arbitrary marks -9, Index dsplayng cursor’s values, Dsplayng statstcs, Addng arbtrary marks
4-9
IM WX104-01E
D
splay
ng Data w
th the Data V
ewer
1
2
3
4
5
6
7
8
9
Index
Dsplayng Cursor’s Values
Clicking the control icon or selecting [Window] - [Control] displays the [Control] dialog box.
For details related to [Control] dialog box, see “Displaying cursor’s values” in section 3.2,
“Displaying the Trend.”
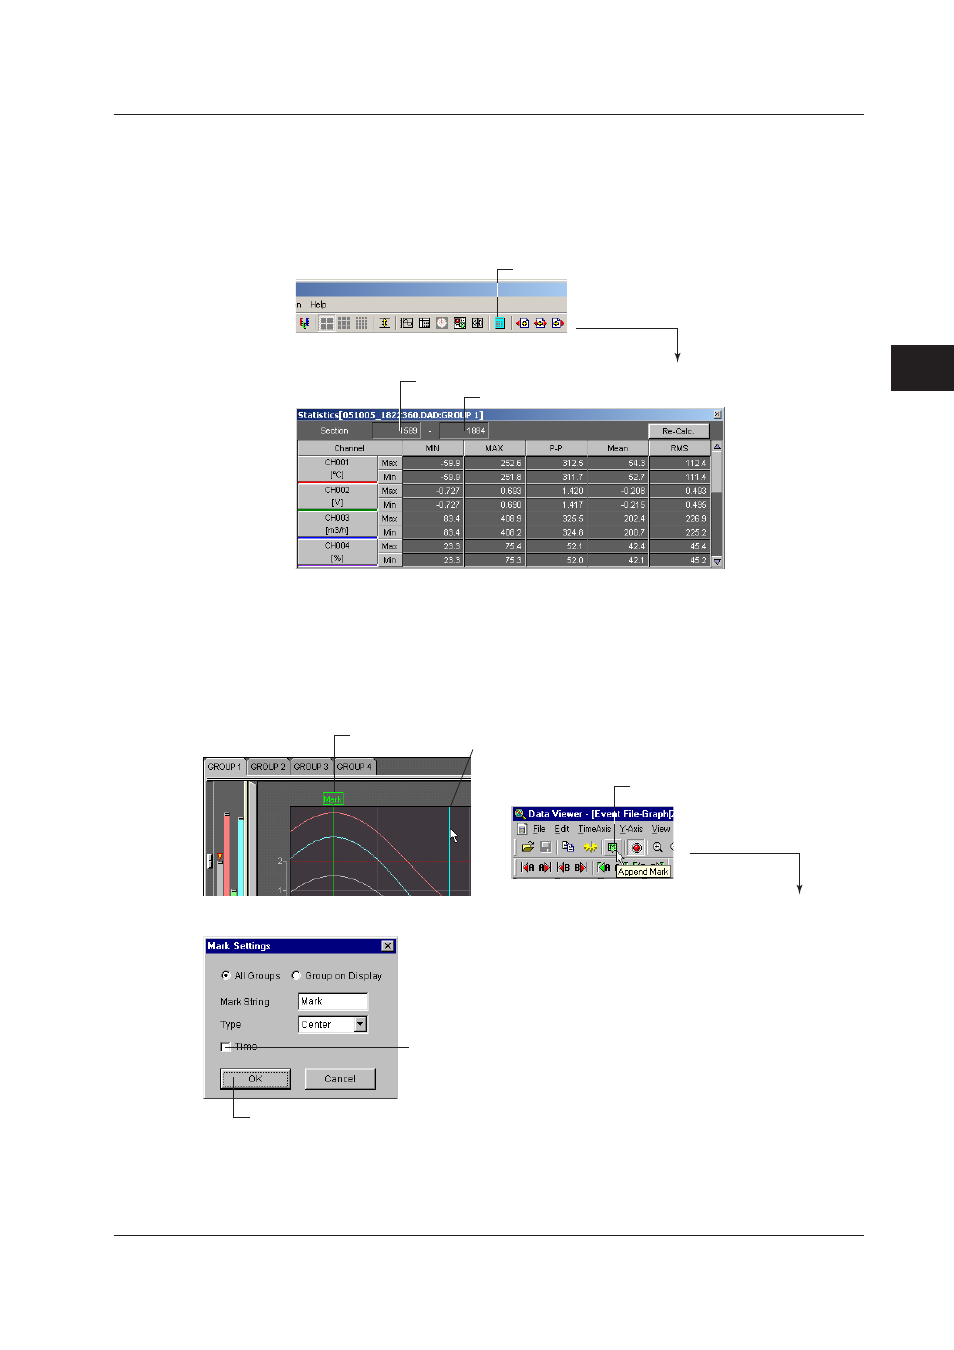
Dsplayng Statstcs
The first data number of the computed region (Cursor A)
1. Click here.
2. The statistics display screen opens.
The last data number of the computed region (Cursor B)
The minimum value, maximum value, P-P, mean, and rms value for each waveform
in the range specified by Cursors A and B are computed and displayed. If the cursor
is not displayed, the computation is performed over the entire data. If you change a
computation condition such as the computation interval and click the [Calculate] button,
the results are computed again and displayed.
Addng Arbtrary Marks
Arbitrary mark
1. Point the cursor.
2. Click here ([View] - [Append Mark]).
4. After entering the string, click the [OK] button
3. The [Mark Settings]
dialog box opens.
Turn ON/OFF the time display
When Cursor A and Cursor B are at the same position, arbitrary marks can be placed. You
can select whether to put the arbitrary marks on all groups or only on the displayed group.
In addition, double-clicking a mark, that has been created using the Data Viewer, opens
the [Mark] dialog box in which you can change the displayed group and the mark name.
4.2 Dsplayng the Waveform