3 displaying the color graph, 3 displaying the color graph -14, 3 dsplayng the color graph – Yokogawa DAQWORX User Manual
Page 49: Dsplayng the color graph, General dsplay settngs
3-14
IM WX104-01E
3.3
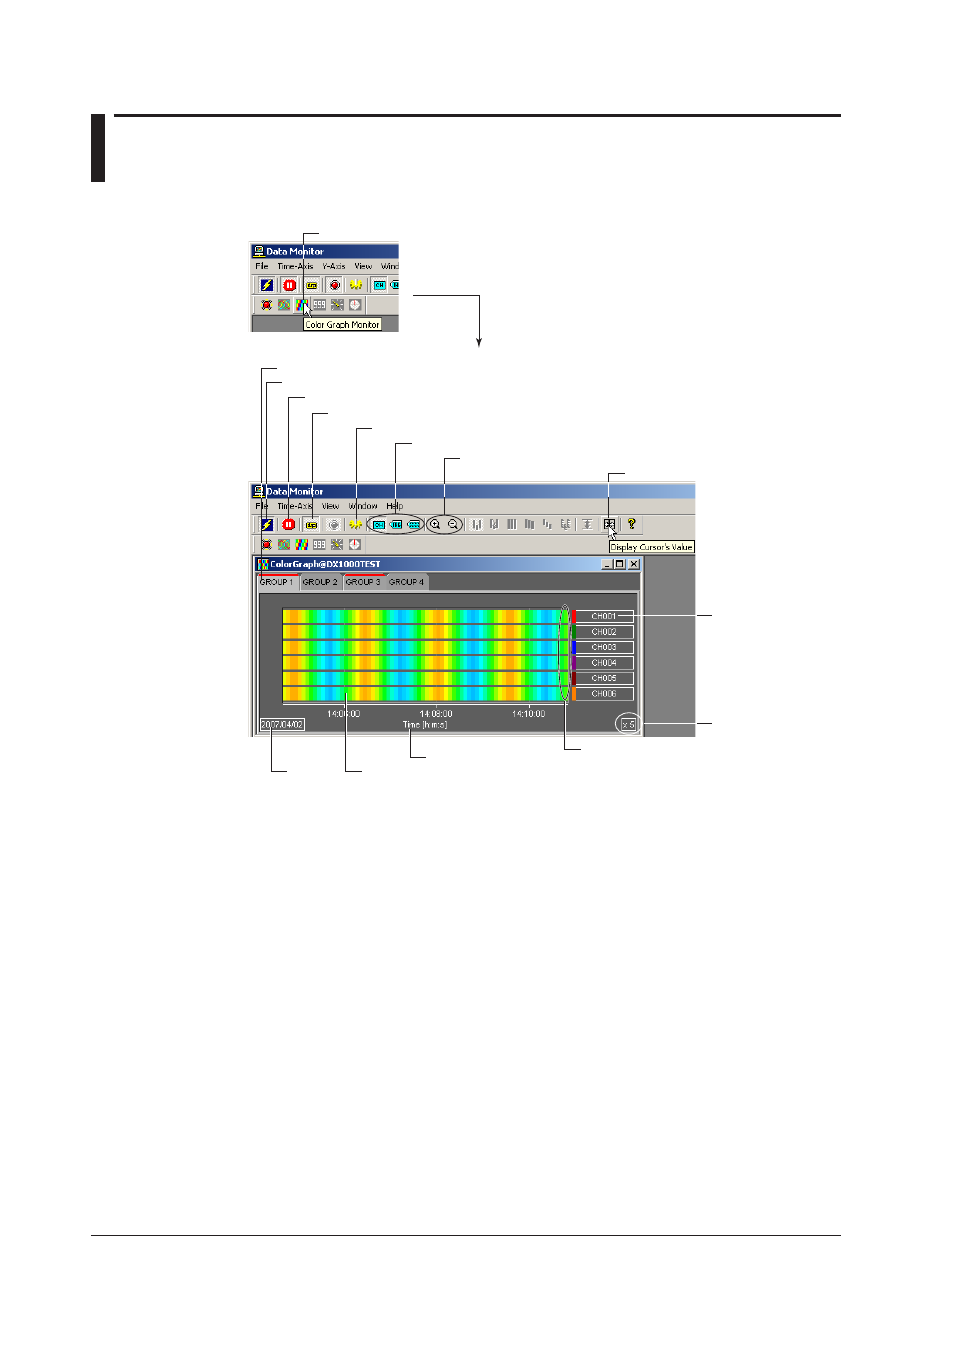
Dsplayng the Color Graph
Dsplayng the Color Graph
Click here ([Window] - [Color Graph Monitor]).
Connect/Disconnect the monitor (section 3.8, 3.10)
Select the displayed group
Pause the monitor (section 3.9)
Turn ON/OFF the link (section 3.9)
General display settings
Characters used to identify channels (section 3.2)
Zoom in or zoom out of the time axis
Display the cursor’s value
Display the channel
No., tag No., or tag
comment
2. The color graph monitor opens.
Magnification
Display color
Absolute or relative time
Date
Display measured data using different colors
General Dsplay Settngs
The parameters in the [General Display Settings] dialog box related to the color graph
display are as follows:
• Turn ON/OFF waveform display: The color graph of the waveform that has channels
registered and is turned ON is displayed.
• Registering the channel:
The measured or computed data of the registered
channel can be displayed.
• Setting the displayed range:
By assigning 50 different colors from the minimum
to the maximum values of the scale, the measured
values are displayed using those colors. The
measured data are colored in the following order:
blue (minimum value), light blue, green, yellow, and
red (maximum value).
• Display color
For details related to the setting procedures, see “General Display Settings” in section 3.2,
“Displaying the Trend.”