Debugging, online functions, Sampling trace, Debugging – Lenze PLC Designer PLC Designer (R2-x) User Manual
Page 75: Breakpoint, L-force | plc designer
L-force | PLC Designer
What is What in PLC Designer
DMS 3.2 EN 02/2011 TD29
73
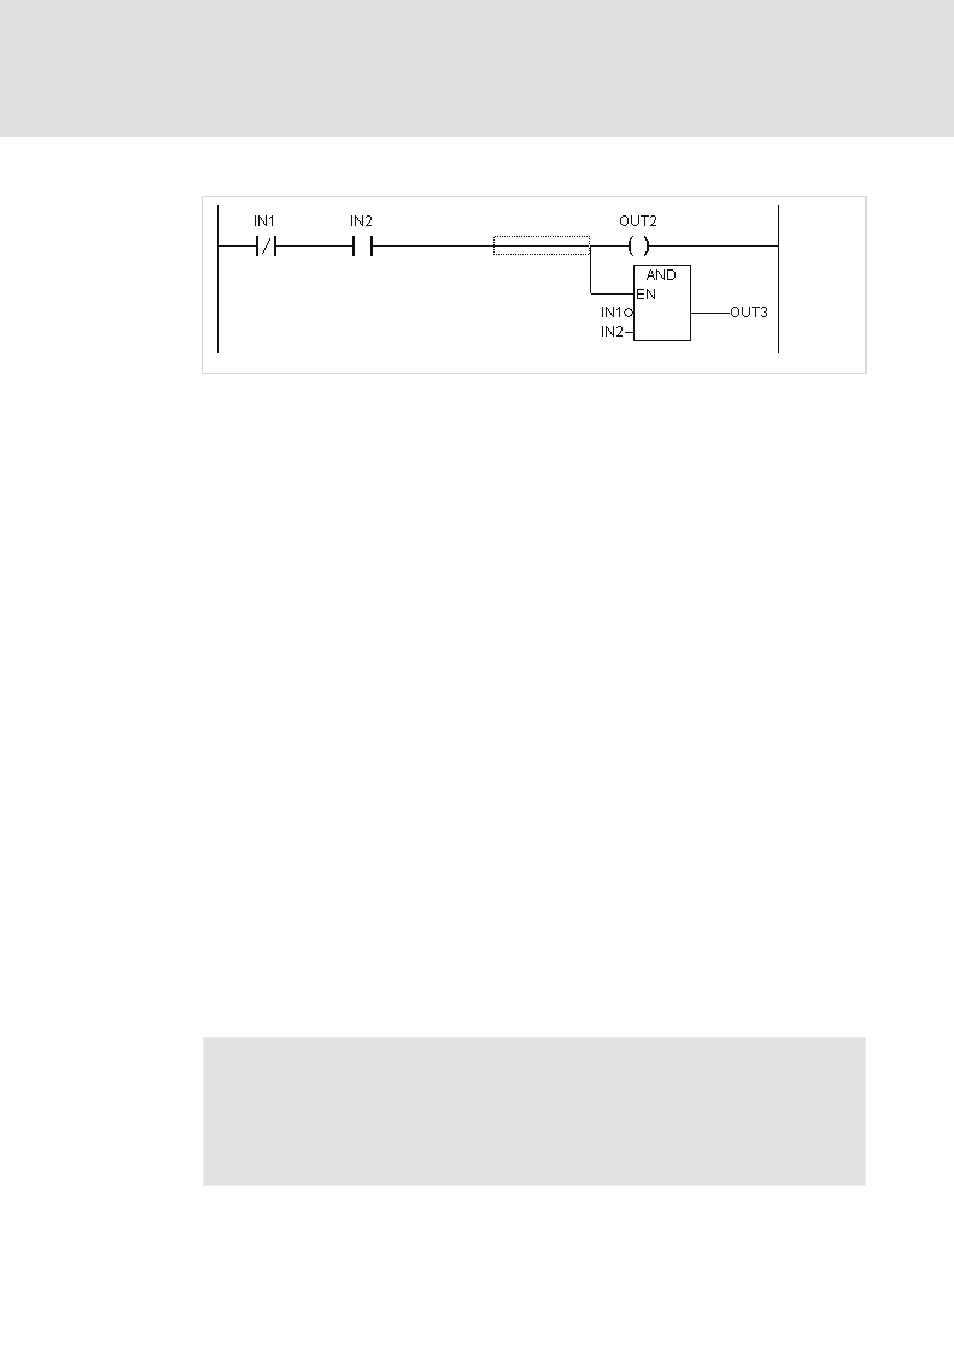
Starting from such an EN POU, you can create networks similar to FBD.
Example of a LD network with an EN POU
4.3
Debugging, Online Functions...
4.3.1
Sampling Trace
The Sampling Trace allows you to trace the value sequence of variables, depending
upon the so-called trigger event. This is the rising edge or falling edge of a previously
defined Boolean variable (trigger variable). »PLC Designer« permits the tracing of up
to 20 variables. 500 values can be traced for each variable.
4.3.2
Debugging
The debugging functions of PLC Designer make it easier for you to find errors.
In order to debug, run the command 'Project' 'Options' and in the dialog box that pops
up under Build options select activate option Debugging.
4.3.3
Breakpoint
A breakpoint is a place in the program at which the processing is stopped. Thus it is
possible to look at the values of variables at specific places within the program.
Breakpoints can be set in all editors. In the text editors breakpoints are set at line
numbers, in FBD and LD at network numbers, in CFC at POUs and in SFC at steps. No
breakpoints can be set in function block instances.
Stop!
Runtime system PLC Designer SP 32 Bit Full will deactivate the watchdog function
of the concerned task as soon as the execution of the program currently is stopped
at a breakpoint.