L-force | plc designer – Lenze PLC Designer PLC Designer (R2-x) User Manual
Page 748
L-force | PLC Designer
PLC Designer Visualization
746
DMS 3.2 EN 02/2011 TD29
Variable/Scale: This button opens the dialog Configure scale and variable, which can
be filled like described for the Meter element.
Color areas: This button opens the dialog Configure color areas: Here you can define a
separate color for each partition of the scale. See the description of the Meter where
the same dialog is available.
Bar color: This button opens the standard dialog for choosing a color. Define a color
for the bar in normal state (no alarm).
Define which range of the array should be displayed:
Arraybegin: First array element to be displayed (Index).
Arrayend: Last array element to be displayed (Index).
Barwidth: Define the width of the bars in percent by the total width available for one
bar.
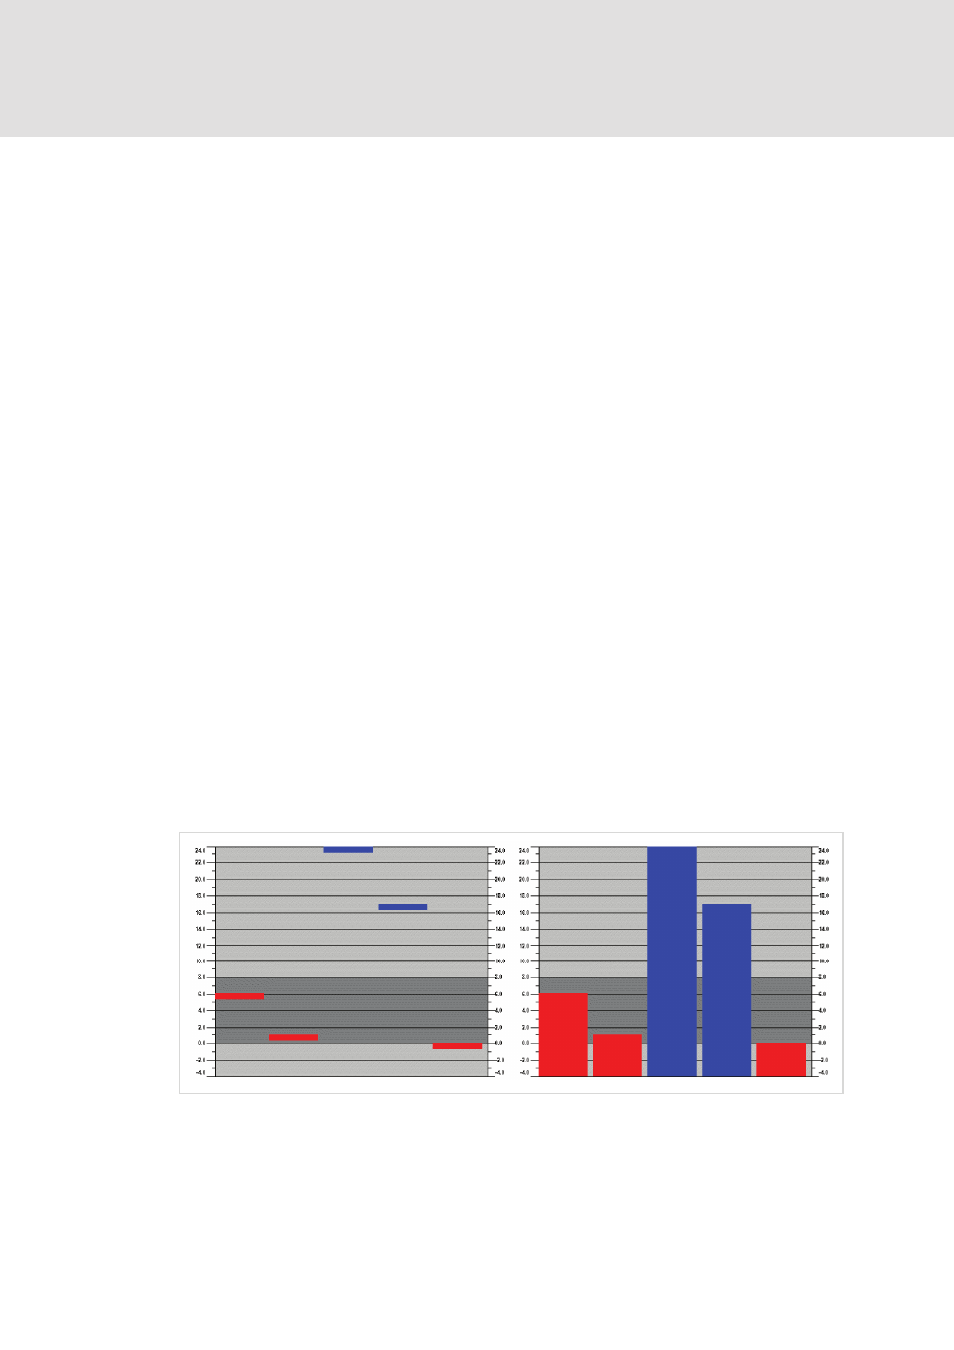
Example:
See in the following picture an example of the online display (bars resp. lines) of a
histogram which represents an array arr1 [0..4] of INT. The arraybegin was set to "0",
the arrayend to "4", the scale start to "–4", the scale end to "24", the main graduation
was set to "2", the sub-graduation to "1" and the scale range 0 – 8 has got assigned
another color (dark grey) than the rest of the scale range. Furtheron the bars should be
displayed alarm-colored (blue) as soon as the value of the corresponding array
element exceeds "8". You see the array elements arr1[2] and arr1[3] currently being in
alarm state: