HP Storage Essentials Enterprise Edition Software User Manual
Page 434

Viewing Performance Data
396
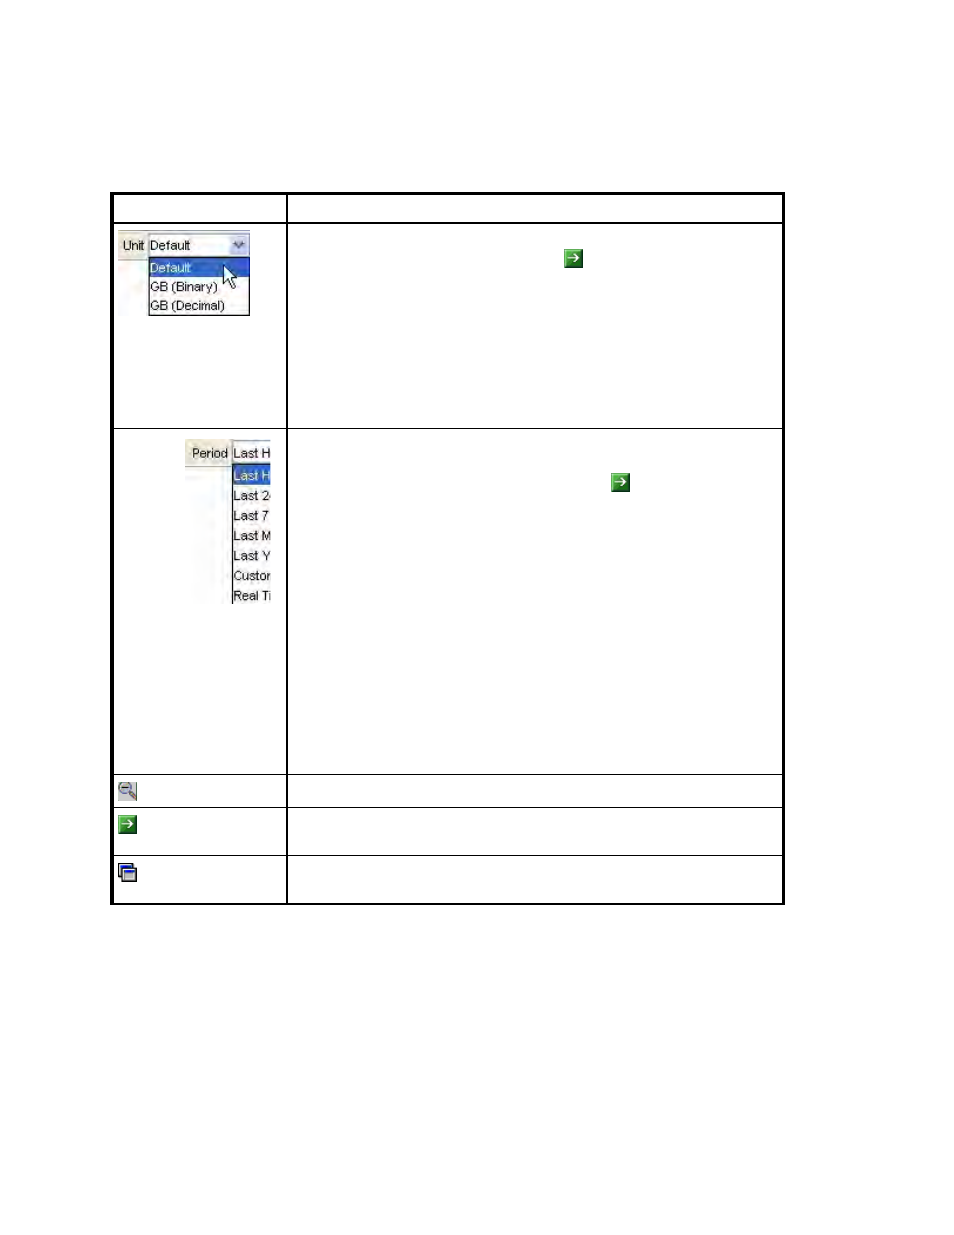
Lets you determine the unit of measurement in the graph. Select one of
the following options, and then click the button:
•
Default - Displays the data in its default unit, which is usually
megabytes.
•
GB (Binary) - Displays the data in binary gigabytes. (The computer
handles the data in binary format. A gigabyte is equal to
1,073,741,824 bytes.)
•
GB (Decimal) - Displays the data in gigabytes. (A gigabyte is equal to
1,000,000,000 bytes.)
Lets you format the graph to provide data within the time period
specified. Select the option to the left of the Period combo box. Select
one of the following options, and then click the button:
•
Last Hour - Information collected in the last hour is reported. If you
select Last Hour, the only frequency available is All.
•
Last 24 Hours - Information collected in the last 24 hours is reported.
•
Last 7 Days - Information collected in the last seven days is reported.
•
Last Month - Information collected in the last month is reported.
•
Last Year - Information collected in the last year is reported.
•
Custom... - Lets you created custom settings for the graph.
•
Real Time - Displays the data as it is currently being gathered by the
management server. If you select Real Time, the only option for
frequency is All and unit is Default.
To set a custom period, select Custom. See ”
page 400 for more information.
Zoom-out button allows you to return to the original data set.
Applies the current period, frequency and trending information to the
chart.
This icon appears in the tool bar of the chart. It lets you filter out the
additional data series if the chart contains more than one series of data.
Table 55
Toolbar in Lower Pane of Performance Manager (continued)
Icon
Description
