Rockwell Automation 5370-CVIM2 Module User Manual
Page 344
Chapter 7
Inspection Tools
7–106
The data in the
Feature Locations
panel appears under three columns,
which are defined as follows:
•
Rank –– This identifies the features in the list in ascending order of their
RMS values. (The currently highlighted item in the panel corresponds to
the green feature window in the image.)
•
Location –– This identifies the X– and Y–axis coordinates of the
upper–left corner of each feature window.
•
RMS Error –– This displays the calculated RMS (root mean square)
error for each feature (refer to the Pixel Error Parameter Selections
section on page 6–43 for details about RMS error calculations).
Note that rank 1 in the
Feature Locations
panel is highlighted. The
corresponding feature window, labeled #1 in the figure, appears in green. All
the other feature windows appear in red. If ranks 2 through 6 are highlighted,
one at a time, the corresponding feature windows will appear in green in the
numerical order shown in the figure.
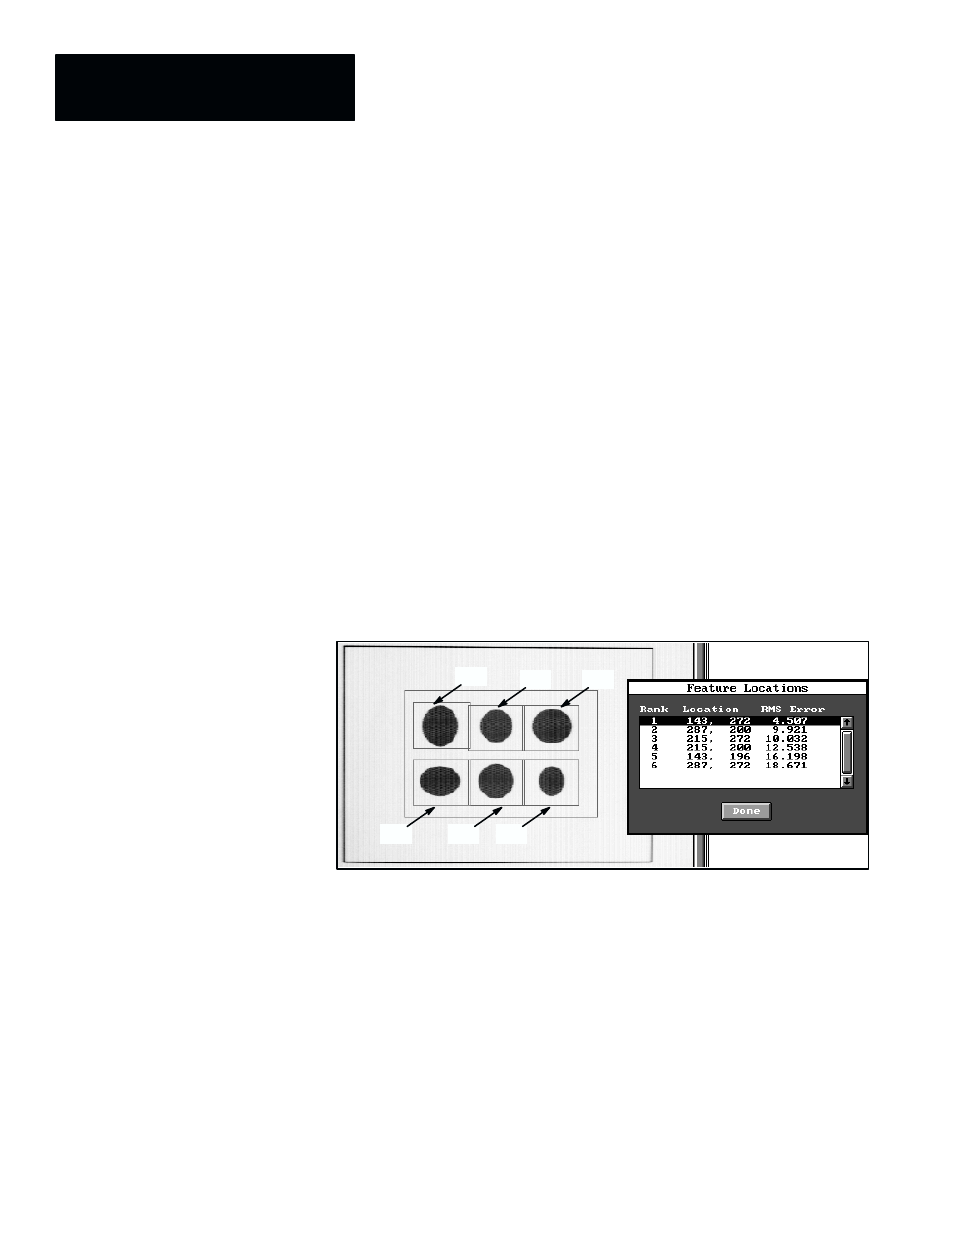
Figure 7.88 illustrates the appearance of the
Feature Locations
panel and
the windows when using the “
Stop When Best
” parameter.
Figure 7.88 Example: Feature Locations Panel (“Stop When Best Feature” Enabled)
#1
#2
#4
#3
#5
#6
Note the slight differences in the coordinate and RMS values in the panel,
and in the numerical order of the feature windows in the image. These
differences arise because the “stop when best” parameter forces the feature
window to scan the entire search window and record the best match at each
object location.
The “stop when first” parameter, however, causes the feature window to be
satisfied when it matches the designated number of objects that match. The
first match may or may not also be the best match in every case. For
example, object #4 in the “stop when first” evaluation (X and Y = 215 and
268; RMS = 13.773) becomes object #3 (X and Y = 215 and 272; RMS =
10.032) in the “stop when best” evaluation.